Figure 4.

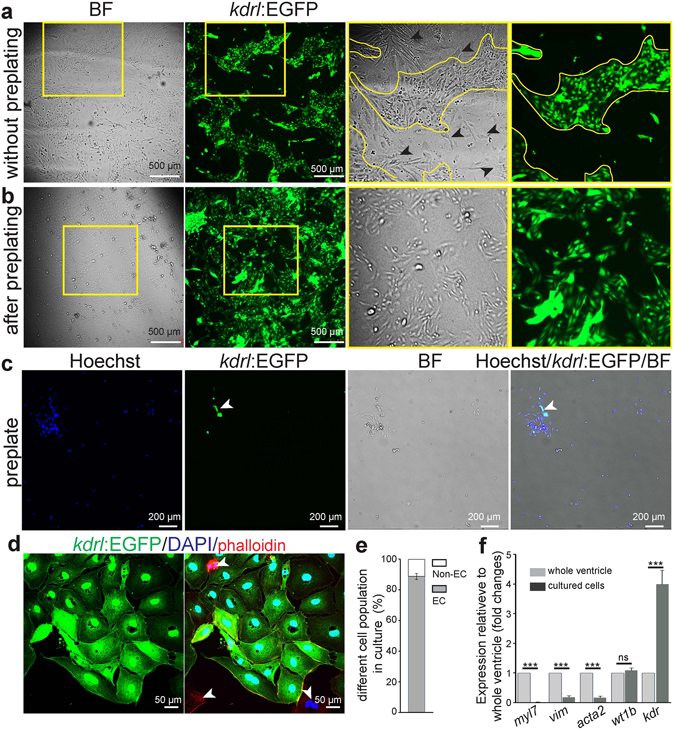
Culture of ventricular endothelial cells isolated from adult Tg(kdrl:EGFP) zebrafish. (a–b) Brightfield and fluorescence images of cultured cells (60 h after seeding) on a fibronectin coated culture dish without a preplating step (a) or after a 4 h preplating step (b). Black arrowheads, non-endothelial cells; BF- Brightfield. (c) Example of brightfield and fluorescence images (green for EGFP positive endothelial cells, and blue for nuclei (Hoechst 33342)) of isolated live ventricular cells on the preplate, after 4 h preplating. (d) Example of cultured cardiac endothelial cells after 1st passage, stained for EGFP (green), rhodamine phalloidin (all cell types, red), and DAPI (nuclei, blue). (e) Quantification of endothelial cells to total cells after 1st passage, showing high purity of the cultures. (n = 3, mean ± SEM). (f) RT-qPCR analysis using cardiomyocyte (myl7), fibroblast (vim), smooth muscle cell (acta2), epicardial (wt1b), and endothelial (kdr) markers (n = 3, mean ± SEM). Marker gene mRNA expression levels relative to α-tubulin were calculated using the ΔCt method (ct values are indicated in the Supplemental Table 2). Expression is relative to the individual marker’s expression in whole cardiac ventricles. All non-endothelial markers, besides wt1b, are depleted in the isolated cell population. Concomitantly, the isolated cells show enrichment for the endothelial marker kdr. One way ANOVA followed by Bonferroni’s post-hoc test (GraphPad Prism) was performed to evaluate statistical significance of differences. P < 0.05 was considered statistically significant. *** corresponds to P < 0.001.
