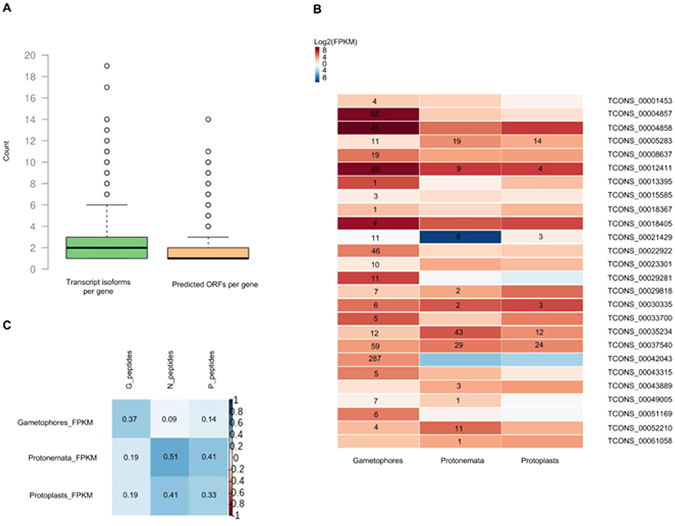
Figure 3.

(A) Bar plot showing the distribution of the number of transcript isoforms and predicted ORFs per gene. (B) Heatmap representing the levels of isoform transcripts of 25 differentially alternatively spliced (DAS) genes. Digits indicate the number of spectra from isoform-specific peptides. (C) Heatmap reports the correlation between the level of transcription of alternative isoforms and the normalized values of spectra from isoform-specific peptides for gametophores (Gametophores_FPKM-G_peptides), protonemata (Protonemata_FPKM-N_peptides) and protoplasts (Protoplasts_FPKM-P_peptides); digits indicate Spearman correlation coefficients.
