
Figure 4.
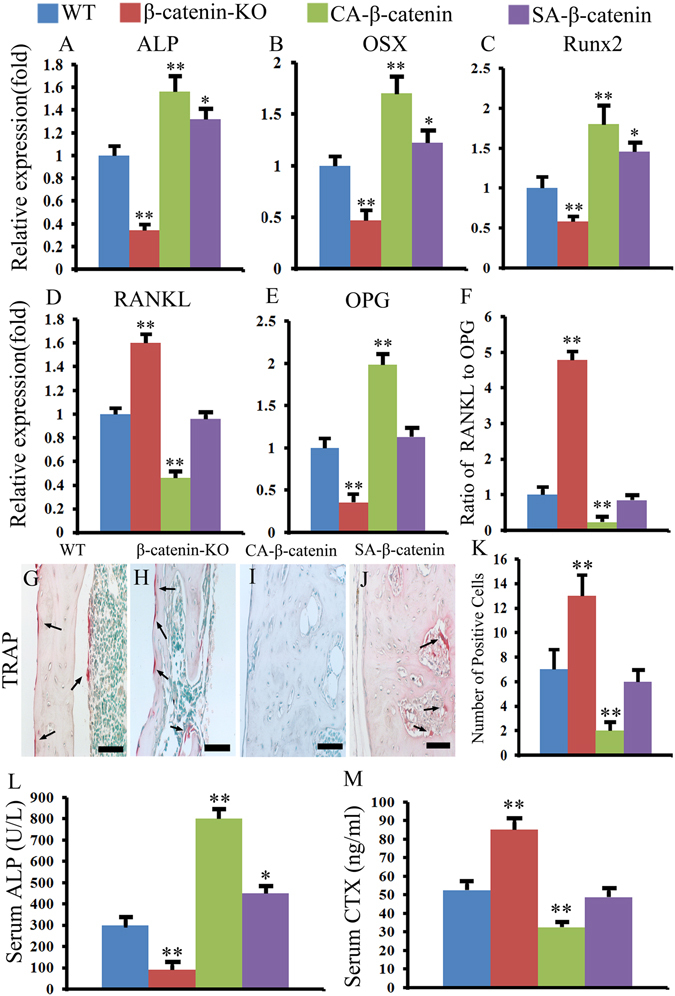
Slight activation of β-catenin in the remodeling phases enhanced bone formation without obvious hindering bone resorption. (A–F) The ALP, OSX, Rux2, RANKL, OPG mRNA expression levels and RANKL/OPG ratio in WT, β-catenin-KO, CA-β-catenin and SA-β-catenin mice. (G–K) Representative TRAP staining of tibia fracture calluses in each group and the quantitative data. (L and M) The serum concentration of ALP and CTX in each group. The values are expressed as the means ± SDs. *p < 0.05, **p < 0.01 (Scale bar = 25 µm in G–J, n = 6/group).