Figure 1.

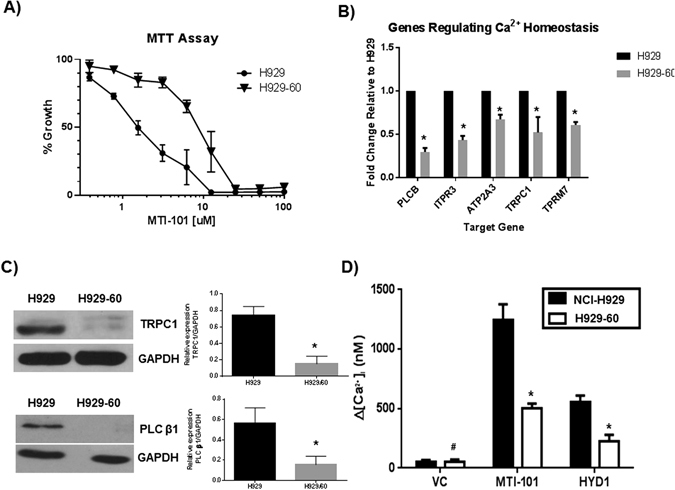
Selection for HYD1 resistance in NCI-H929 MM cells correlates with changes in Ca2+ signaling pathways. (A) Effect of MTI-101 on parentral (NCI-H929) and acquired drug resistant H929-60 cells. The H929-60 cells were developed by continuous exposure to the first generation linear peptide referred to as HYD-1. The H929-60 cell line is cross resistant to MTI-101 induced growth arrest. IC50 values of MTI-101 were determined using the MTT cell viability assay. Each value in the curve is the average of 3 independent experiments ± standard deviation. The resistant cell line was 7.8 fold resistant (n = 3 independent experiments p < 0.05 t-test). (B,C) Select genes were further validated by real time RT-PCR (n = 3 independent experiments p < 0.05, Student’s t-test, multiple testing corrected by Bonferroni-Dunn method) and western blot analysis (n = 3 independent experiments, shown is a representative blot). (D) Effect of MTI-101 on intracellular Ca2+ levels in NCI-H929 and H929-60 cells. H929 and H929-60 MM cells were adhered to cell-tak coated plates and were incubated with Fura-2 dye for 30 min. Time-lapse images were taken every 10 seconds for either 60 min after treatment with 75 µM HYD1 or 30 min after treatment with 3 µM MTI-101. Drug was delivered using a constant flow rate of continuous exposure of the drug. A one-way ANOVA test was used to determine significance (#p > 0.05; *p < 0.05; n = 30 or greater).
