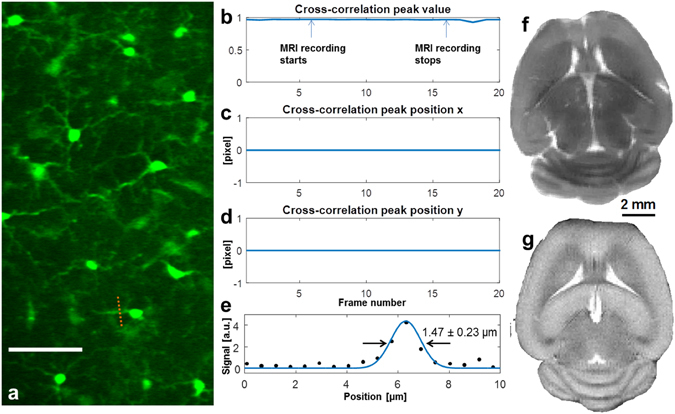
Figure 3.

TPM imaging inside the 16.4T MRI magnet. (a) TPM images of microglia cells in a fixed CX3CR1 mouse brain (scale bar: 50 μm). (b–d) The cross-correlation peak value and peak positions of the time lapsed TPM images during which we performed MRI recording. The cross-correlation shows that the operation of MRI had no influence on TPM. (e) Cross-sectional plot of the process of microglia and its Gaussian fitting (blue line) to determine the FWHM values. (f) Ex vivo ultrahigh-resolution spin-echo multiple-slice MRI of the same fixed mouse brain (axial orientation, 117 μm × 117 μm in plane resolution, 1 mm slice thickness, and 2 signal averages) acquired at 16.4 T. (g) In vivo ultrahigh-resolution mouse brain image (102 μm × 102 μm in plane resolution, 0.5 mm slice thickness and 4 signal averages) acquired from a different mouse at 9.4T for comparison.
