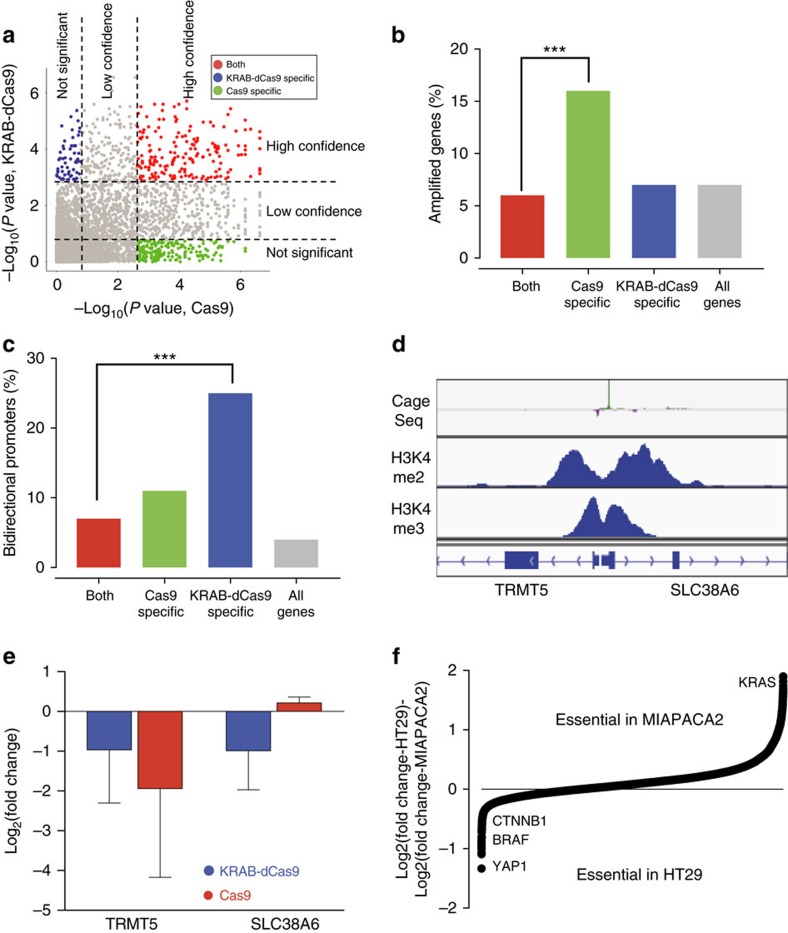
Figure 3. Genome scale CRISPRi proliferation screens.
(a) MAGECK22 was used to identify statistically significant cell essential genes in HT29 cells expressing Cas9 or KRAB-dCas9. Genes scored to be essential were categorized into three groups: ‘both' (essential in both Cas9 and KRAB-dCas9), ‘KRAB-dCas9 specific' and ‘Cas9 specific'. (b) The percentage (%) of amplified genes in three categories. ***P<0.001, Fisher's exact test. (c) The percentage (%) of genes containing bidirectional promoters in three categories. ***P<0.001, Fisher's exact test. (d) Peaks of cage-seq (from ref. 16) and ChIP-seq peaks of H3K4-me2 and H3K4-me3 in the promoter region of TRMT5 and SLC38A6. (e) Proliferation changes induced by KRAB-dCas9 (blue) or Cas9 (red) in HT29 cells. Error bars represent deviation from the mean of all sgRNAs targeting the indicated genes. (f) Comparison of genetic dependencies between HT29 and MIAPACA2 cells expressing KRAB-dCas9. Genes are ranked based on the Log2[FC] difference between MIAPACA2 and HT29 cells. All FCs are presented as the mean of duplicate experiments.

