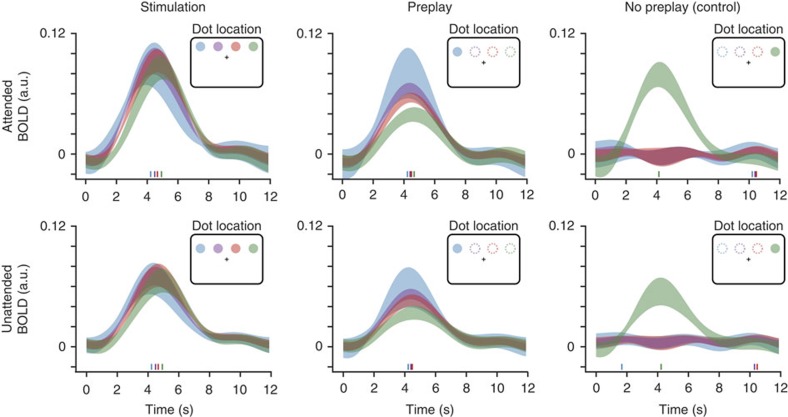
Figure 2. Average BOLD responses at the four stimulus locations.
BOLD response during presentation of the stimulus sequence (left), preplay (middle) and no preplay (right) for the attended and unattended conditions, respectively. The two different stimulus sequences, left-right and right-left, were combined by averaging the respective trials. Coloured lines along the time axis depict the BOLD peaks. Shaded areas denote ±s.d.

