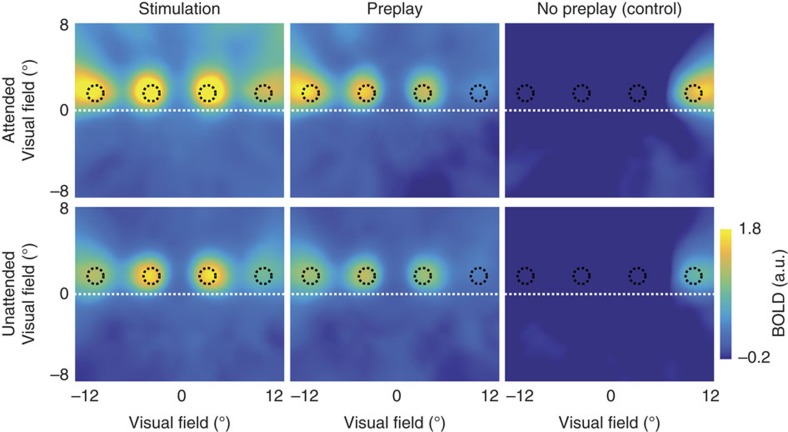
Figure 3. Stimulus reconstruction from BOLD activity in V1.
Reconstruction of the BOLD response evoked by stimulation, preplay and control conditions. Images were obtained by weighting all voxels' Gaussian receptive fields by the respective BOLD amplitude in each condition and then averaging these responses over all pRFs. The black circles illustrate the spatial position of the dots. The dashed white line depicts the horizontal meridian.

