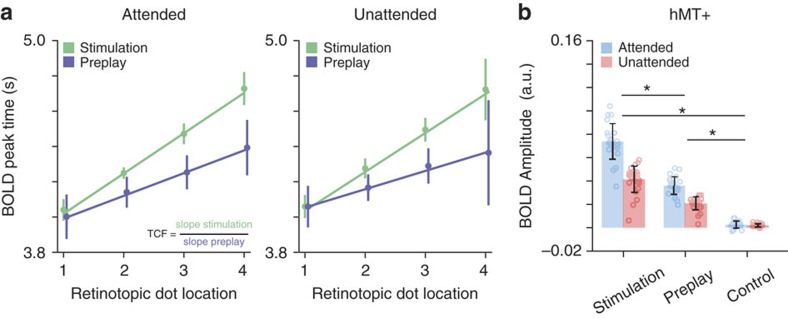
Figure 4. Temporal compression of activity preplay in V1.
(a) Peak time of the BOLD responses averaged for voxels at the four retinotopically defined stimulus locations. The fitted slope reflects the speed of the BOLD activity sequence, where a steeper slope corresponds to a temporally slower activity wave. The slopes were used to calculate the TCF for preplay compared to the stimulus sequence. (b) Average BOLD amplitude in hMT+ for stimulation, preplay and control for the attended and unattended task conditions, respectively. Error bars denote ±s.e.m.; *P<0.05.

