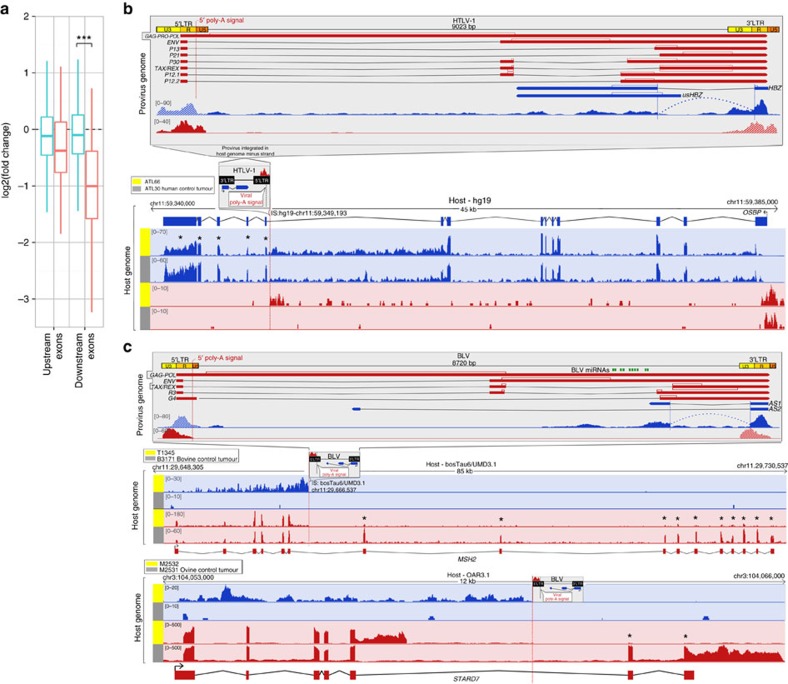
Figure 1. Provirus-dependent host gene interruption in HTLV-1/BLV primary tumours with genic-concordant proviral integration.
(a) Normalized RNA-seq read counts of upstream (left) and downstream (right) exons relative to the proviral integration site in the tumour set characterized by genic-concordant proviruses (red plot, N=21) and control tumours without integration in that gene (blue plot). ***P=5.878e-08 (Mann–Whitney U-test). (b) Transcription patterns of human leukaemia ATL66 shown as RNA-seq sense (red) and antisense (blue) coverage mapped to the proviral (top) or host (bottom) genomes visualized in Integrative Genomic Viewer (IGV)59. Top panel: HTLV-1 proviral genome flanked by 5′LTR/3′LTR redundant regions (U3, R, U5) that contain regulatory elements, transcriptional start sites (TSS) and poly-(A) signal. Positive-strand transcripts (red) encode structural and regulatory (TAX/REX) proteins; spliced HBZ antisense transcripts (blue) expressed from negative-strand. ATL66 RNA-seq coverage of HTLV-1: HBZ antisense transcripts and upstream coverage exposing hybrid transcripts; positive coverage of 5′LTR reveals read-through transcription and provirus-dependent premature polyadenylation of host gene OSBP. Absence of 5′LTR-driven viral transcription. Bottom panel: mapping to host genome (hg19). Small box: HTLV-1 integration in OSBP introns 9–10 (opposite orientation). OSBP exons 10–14 show decreased coverage (*ATL66/control ATLs (N=39): 52% decrease, ATL66 OSBP downstream/upstream exons, fold-change=0.52). Sense coverage: 3′LTR-dependent chimeric transcript in antisense overlap with OSBP. (c) Transcription patterns of bovine T1345/ovine M2532 B-cell tumours shown as RNA-seq sense (red) and antisense (blue) coverage mapped to the proviral (top) or host (bottom) genomes. Top: BLV genome, annotation and T1345 RNA-seq coverage representative of both tumours: AS1 antisense transcription; positive coverage of 5′LTR reveals host gene transcription (read-through) and provirus-dependent premature polyadenylation. Bottom panels: mapping to host genomes (UMD3.1 and OAR3.1). Small box: BLV integration in MSH2 (ref. 33) intron 6 or STARD7 (ref. 34) intron 5. Decrease of MSH2 and STARD7 downstream exon coverage (*MSH2 T1345/control tumours (N=14), 88% decrease; T1345 MSH2 downstream/upstream exons, fold-change=0.12 and STARD7: 96% decrease (control tumours, N=31), downstream/upstream exon fold-change=0.08). Antisense coverage: 3′AS-dependent chimeric transcript in antisense overlap with MSH2/STARD7. See also Supplementary Fig. 3 for RNA-seq coverage assignment to 5′LTR/3′LTR.

