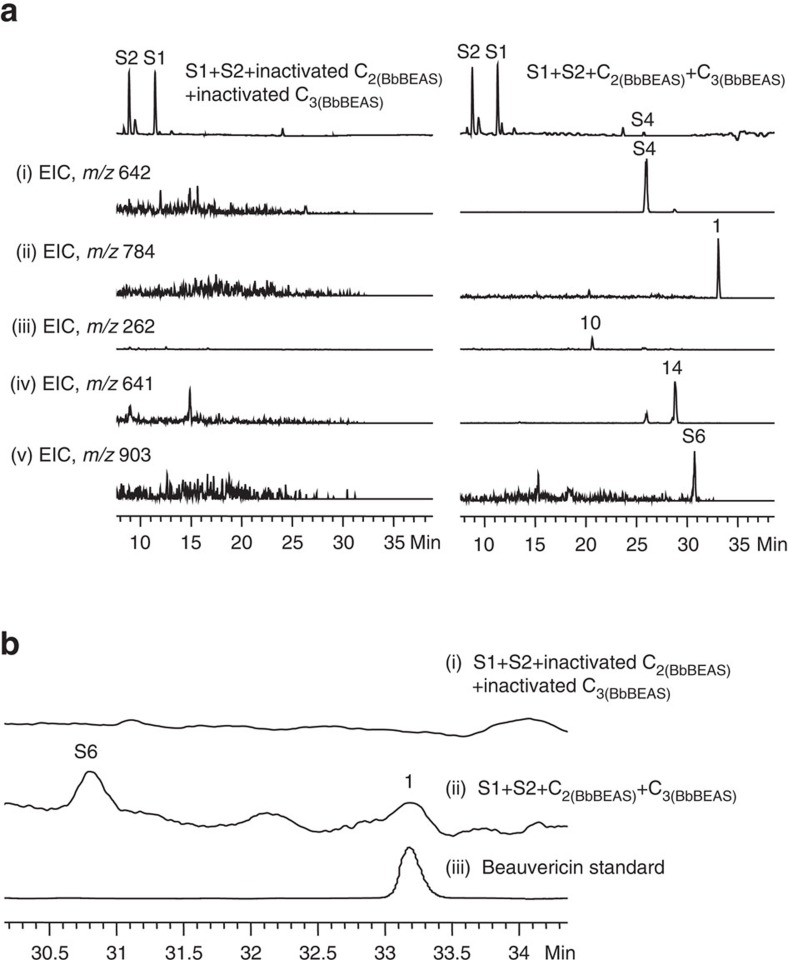
Figure 6. In vitro total biosynthesis of 1 using C2 and C3 domains.
(a) LC–MS analysis of the in vitro reaction of C2(BbBEAS) and C3(BbBEAS) with S1 and S2. The left panel is the negative control with inactivated C2 and C3, while the right is the actual reaction. The HPLC traces are shown on the top, followed by the EICs of the intermediates and final product. (i)–(v) are EICs at m/z 642 (i), 784 (ii), 262 (iii), 641 (iv) and 903 (v), respectively. (b) Enlarged view of the region of 30.1–34.4 min of the HPLC traces of the negative control (i), reaction (ii) and the standard of 1 (iii).

