Figure 2.
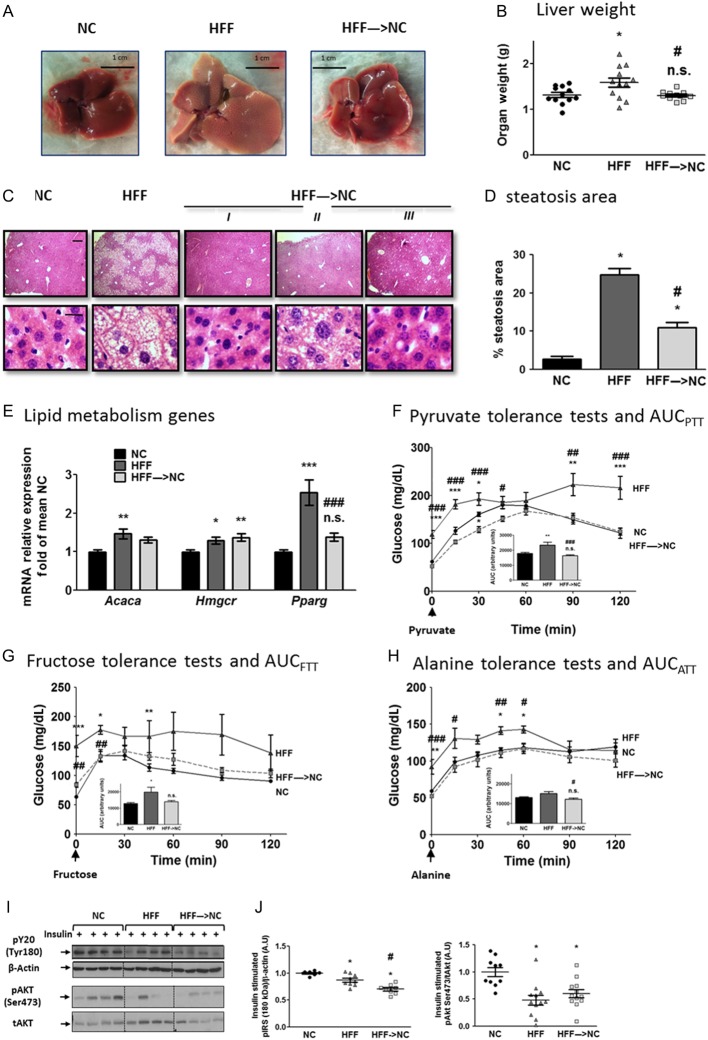
Early hepatic response to obesity reversal. Representative images (A) and weights (B) of livers 14 days after dietary switch (n = 11–12/group). (C) Representative liver hematoxylin and eosin (H&E)-stained histological sections of the three groups. I, II and III are sections from 3 individual mice from the HFF→NC group, demonstrating the variability in this group. (D) Mean area identified as steatotic (n = 4 for NC, HFF and n = 8 for HFF→NC. (E) Quantitative real-time PCR of liver expression of lipid metabolism genes: acetyl CoA carboxylase1 (Acaca), HNG CoA reductase (Hmgcr) and peroxisome proliferator-activated receptor γ (PPARγ). Values are the ΔΔCT values adjusted to Rplp0 and Hprt and are presented as fold of mean NC values (n = 15–16/group, from 4 independent experiments). (F, G and H) Results of pyruvate, fructose and alanine tolerance tests (PTT, FTT and ATT, respectively): twelve days after dietary reversal, mice were injected intraperitoneally with 2 g/kg BW each of the respective metabolites after an overnight fast. Glucose excursions during the following 2 h are shown. Insets are graphs of the calculated area under the curve (AUC). n = 9–10/group for PTT, n = 5–6/group for FTT and ATT). (I and J) Representative blots and densitometry of insulin signaling molecules in the liver. Mice were fasted overnight, and killed 12 min after intraperitoneal injection of 0.2 U/kg insulin. n = 7–12/group, from 2 to 3 independent experiments. *P < 0.05 compared to NC; #P < 0.05 compared to HFF; ** or ##P < 0.01 compared to NC or HFF, respectively; *** or ###P < 0.001 compared to NC or HFF, respectively; n.s. – non-significant (P > 0.05) compared to NC.

 This work is licensed under a