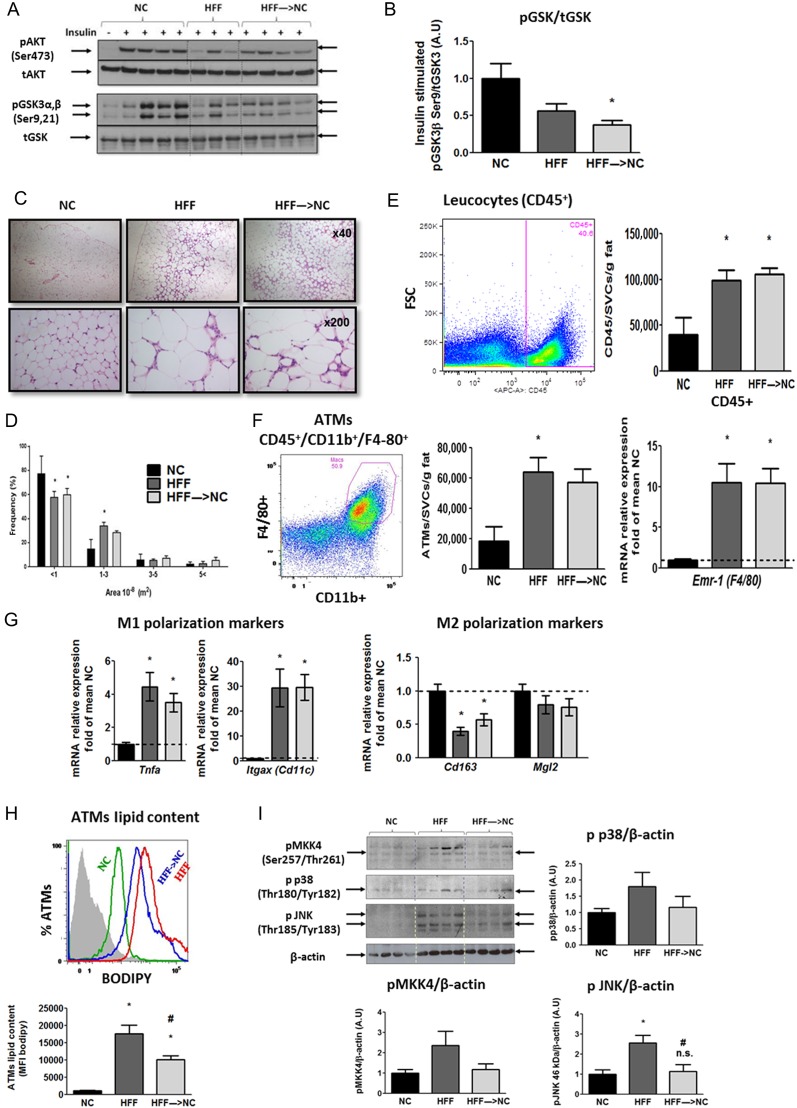
Figure 3.
Adipose tissue adaptation to 2 weeks obesity reversal. (A and B) Representative blots and densitometry (n = 7–12/group from 2 to 3 independent experiments) of insulin signaling proteins in epididymal adipose tissue of mice treated as detailed in Fig. 2I and J. (C and D) Representative adipose tissue histological sections stained with H&E, and estimated size distribution. Flow Cytometry analyses of adipose tissue stromal-vascular cell fraction: Leucocytes were identified as CD45+ (E), adipose tissue macrophages (ATMs) as CD11b+F4/80+ (F), and ATM lipid content was assessed using the neutral lipid fluorescent dye BODIPY (H). Results are mean ± s.e.m. of mice from 2 independent experiments. Quantitative real-time PCR analysis in epididymal adipose tissue: Emr-1 (F4/80) as a marker for macrophages (F), Tnfa was used as a classical pro-inflammatory cytokine and with Itgax (Cd11c) as M1 markers, and Cd163 and Mgl2 as markers of alternatively activated, M2 macrophages (G). Values are the ΔΔCT adjusted to Rplp0 and Hprt, and are represented as fold of mean value of the NC group (n = 14–17/group from 5 independent experiments). (I) Representative blots and densitometry of adipose tissue stress signaling proteins. Densitometry are mean ± s.e.m. of n = 11–16/group from 3 to 4 independent experiments, with the mean value of the NC group defined as a value of 1. n.s. or *P < 0.05 vs NC, #P < 0.05 vs HFF. A full colour version of this figure is available at http://dx.doi.org/10.1530/JOE-17-0007.

 This work is licensed under a