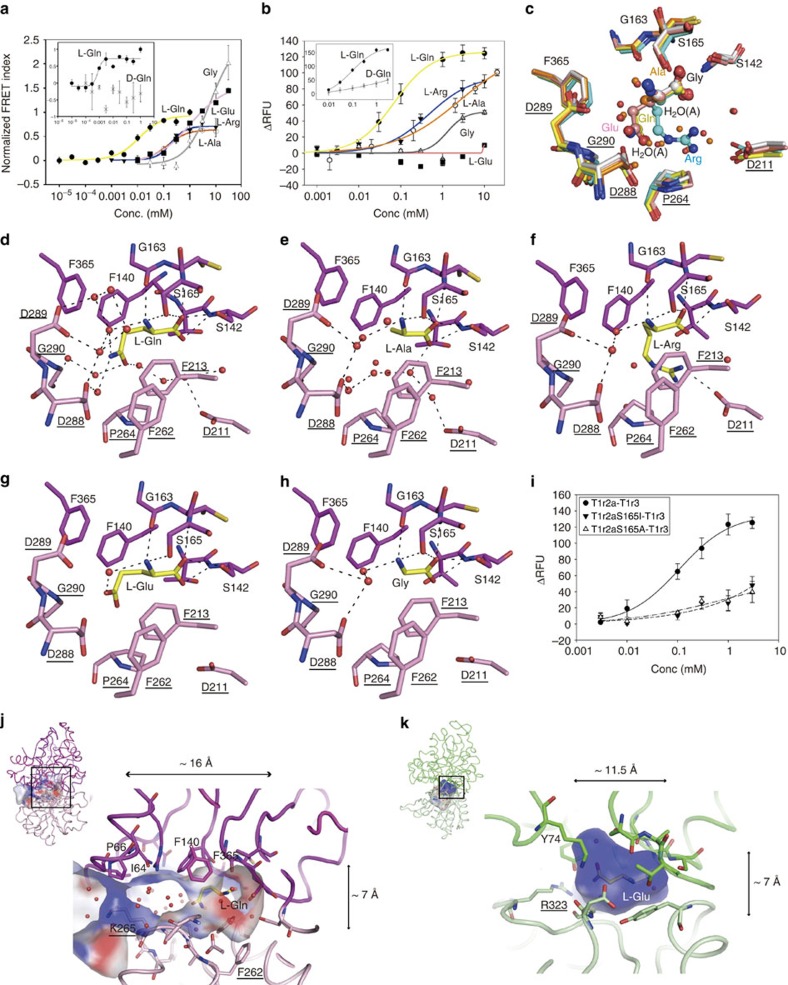
Figure 2. Amino-acid recognition by T1r2aLBD.
(a) Dose-dependent FRET signal changes of the T1r2aLBD-Cerulean and T1r3LBD-Venus heterodimer for amino acid binding. Data points represent mean and s.e.m. of three technical replicates. (b) Dose-response curves for various amino acids by the full-length T1r2a–T1r3 receptor in HEK293 cells, monitored as an elevation of intracellular Ca2+ concentration. Data points represent mean and s.e.m. of six, eight, six, six and four technical replicates for the Gln, Arg, Ala, Gly and Glu responses, respectively. For a,b, the insets are the curves for L- and D-glutamine. (three and four technical replicates for a,b, respectively.) (c–h) Close-up view of the T1r2a ligand-binding site of the L-glutamine-, L-alanine-, L-arginine-, L-glutamate- and glycine-bound structures. (c) super-imposition of all structures, with the water molecules observed at the binding site of the glutamine-bound (red) and alanine-bound (orange) structures plotted, and those specifically observed on the alanine-bound structure labelled as ‘H2O(A)'. (d) L-Glutamine-bound structure, (e) L-alanine-bound structure, (f) L-arginine-bound structure, (g) L-glutamate-bound structure, (h) glycine-bound structure. (i) L-Glutamine responses of the wild-type T1r2a–T1r3, and T1r2a:S165I–T1r3 and T1r2a:S165A–T1r3 mutants, monitored as an elevation of intracellular Ca2+ concentration. Data points represent mean and s.e.m. of 4 technical replicates. (j,k) The ligand-binding pockets observed on T1r2a (j) and mGluR1 (PDB ID 1EWK, A chain) (k) crystal structures. The electrostatic potentials at±20 kT e−1 were mapped on the surfaces. In all panels, the residues at LB2 are underlined.

