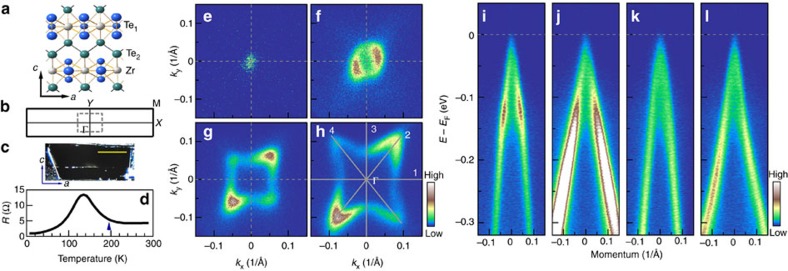
Figure 1. Fermi surface and band structure of ZrTe5 measured at 195 K.
(a) Top view of the bulk crystal structure (ac plane) of the ZrTe5 sheet. The blue and green spheres represent Te atoms and the grey ones represent Zr atoms. ZrTe5 crystal is constructed from stacking of the ZrTe5 sheets along the b axis (perpendicular to the ac plane). (b) Surface Brillouin zone corresponding to ac plane. High-symmetry points are indicated. The central dashed-line square indicates the measured momentum space covered by our ARPES mapping in e–h. (c) The cleaved surface morphology of a thick ZrTe5 sample, which is flat and mirror-like. The scale bar in this panel represents 1 mm. (d) Temperature dependence of resistivity for our ZrTe5 single-crystal samples; there is a clear resistivity peak at ∼135 K. (e–h) Constant energy contours of ZrTe5 at different binding energies of 0, 100, 200 and 300 meV, respectively. The spectral intensity is integrated within 10 meV with respect to each binding energy. The measurement geometry is set under s polarization. (i–l) Band structures measured along typical cuts 1, 2, 3 and 4, respectively. The location of the momentum cuts is shown in h by thick grey lines.

