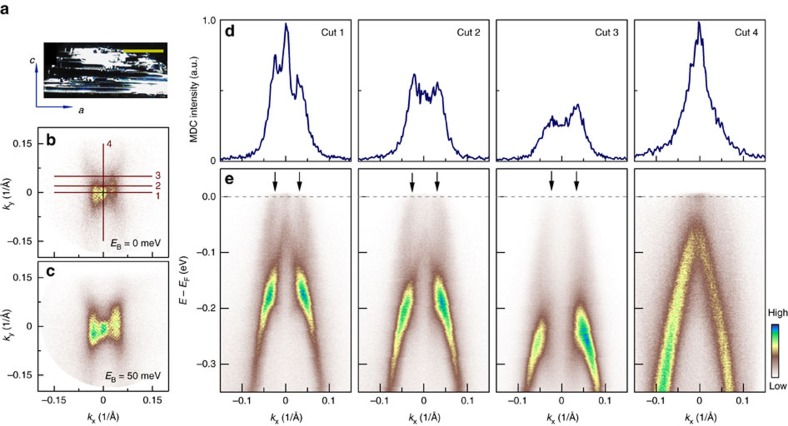
Figure 4. Observation of weak topological insulator feature in some ZrTe5 samples.
(a) Cleaved surface morphology of some thin ZrTe5 samples or thin ZrTe5 samples after temperature cycling. There are one-dimensional thread-like structures running along the a axis. The additional features presented here are taken on this kind of samples. The scale bar in this panel represents 1 mm. (b,c) Constant energy contours of ZrTe5 measured around 15 K at binding energy of 0 and 50 meV, respectively. Besides the tiny pocket near the Γ point, there are two nearly one-dimensional spectral streaks on both sides of Γ point running along Γ–Y direction. Band structures measured along momentum cuts 1, 2, 3 and 4 are shown in e. The locations of these momentum cuts are indicated in b. Corresponding MDCs at Fermi level for band structures in e are shown in d. In addition to the usual bands observed in ZrTe5 as shown in Fig. 1i–l, addition bands are observed here that are marked by the arrows in e.

