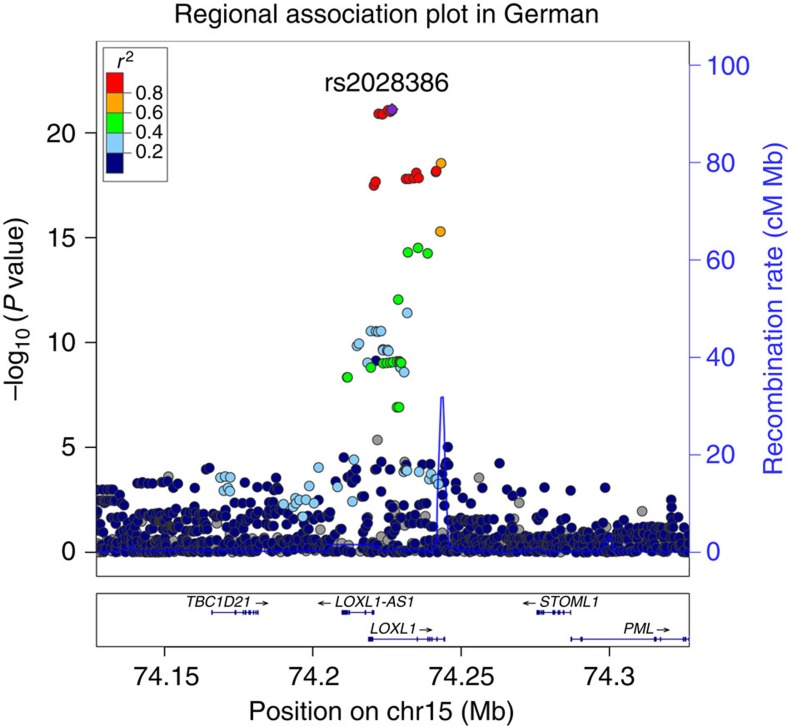
Figure 1. Regional association plot of the 15q24.1 locus in GWA analysis of German PEX data set.
Regional association plot for LOXL1 gene with 100 kb upstream and downstream regions shows the association peak region for SNPs located on the LOXL1 gene locus. Association analysis was performed using a logistic regression model adjusted for age and gender. The data of all SNPs are indicated as circles. The red and orange circles represent the 14 SNPs showing major association. The left Y-axis represents –log10 P values and the right Y axis represents the recombination rate. The X axis represents position of SNPs on chromosome 15 (human genome build GRCh37/hg19).

