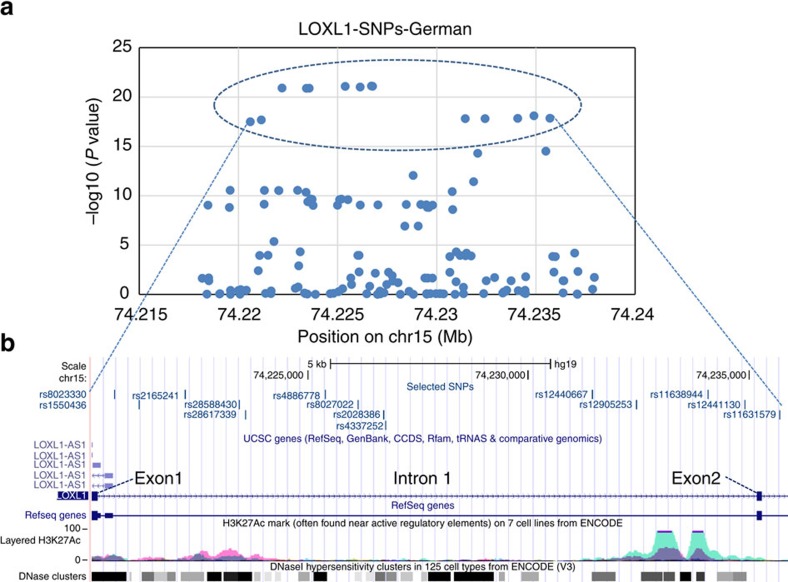
Figure 2. Zoom of the regional association plot on the LOXL1 gene locus based on German data set.
(a). The zoom of Fig. 1 into the LOXL1 locus (chr15:74,218,178-74,237,946) shows the 14 selected SNPs with P values<10−15 (encircled by dotted line). (b) Distribution of the 14 SNPs within the LOXL1 gene region encompassing exon 1, intron 1, exon 2 and start of intron 2. SNPs ID and their localization are shown using a modified screen shot from the UCSC genome browser (http://genome.ucsc.edu: GRCh37/hg19). ENCODE Regulation Tracks indicate layered histone marks for H3K27Ac (often found near regulatory elements) and DNAse hypersensitivity regions (corresponding to open chromatin indicating active regulatory sites).

