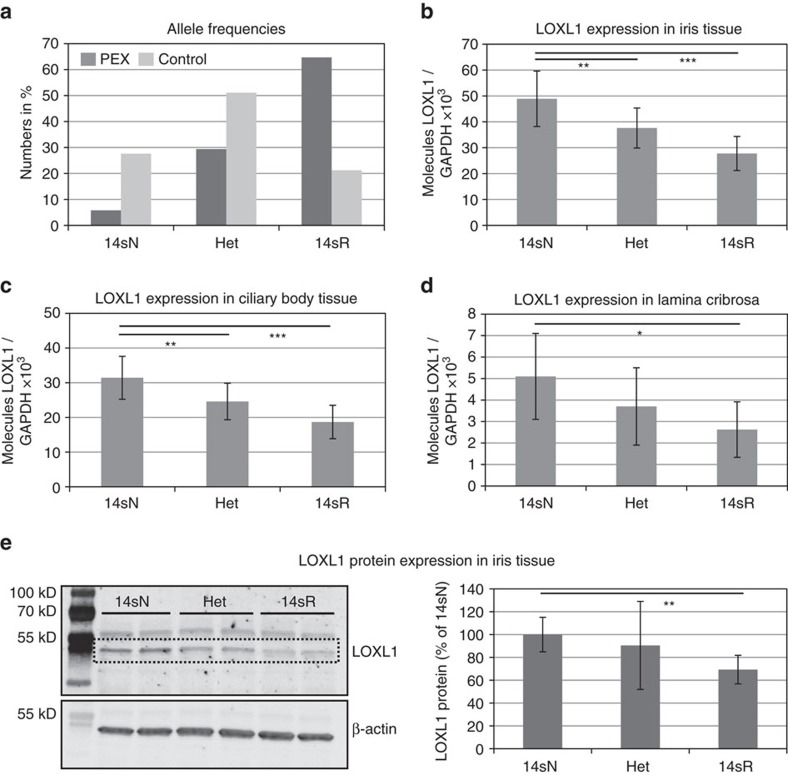
Figure 3. Correlation of LOXL1 risk variants with LOXL1 tissue expression levels.
(a) Frequency of the homozygous risk (14sR), non-risk (14sN) and heterozygous (Het) haplotypes formed by the 14 selected SNPs in PEX (n=52) and control (n=51) samples. (b) Genotype-correlated expression levels of LOXL1 mRNA in iris tissue samples (n=103) obtained from PEX (n=52) and control (n=51) patients using real time PCR technology; data are presented as mean values±s.d. (c) Genotype-correlated expression levels of LOXL1 mRNA in ciliary body tissue (n=103). (d) Genotype-correlated expression levels of LOXL1 mRNA in lamina cribrosa specimens (n=30). (e) Western Blot analysis of LOXL1 protein expression in iris specimens (n=18) according to LOXL1 genotypes; specific bands indicating LOXL1 appear at 52 kDa. Equal loading of samples was verified by immunodetection of ß-actin, and LOXL1 expression levels were normalized to ß-actin expression. Densitometry analysis of band intensities shows mean values±s.d. of three independent experiments (n=6 samples for each genotype) (the two other Western blots are shown in Supplementary Fig. 3) (*P<0.05; **P<0.001; ***P<0.0001; unpaired two-tailed Student's t-test).

