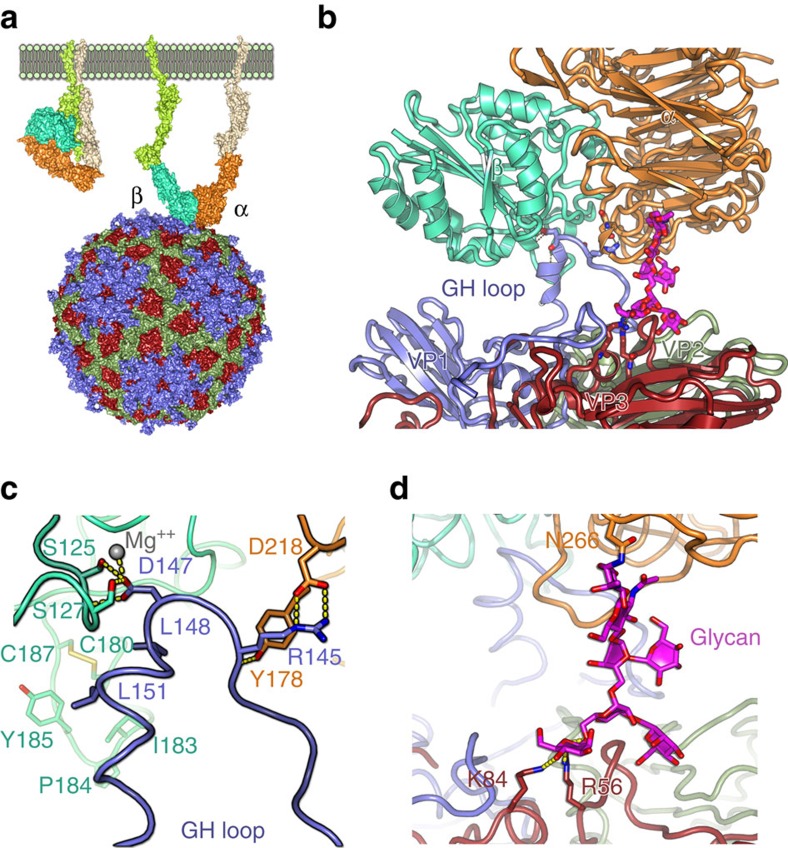
Figure 5. The major binding mode.
(a) The schematic shows the change in conformation of the integrin from the ‘closed' state (left) to the ‘open' (right) as visualized in the capsid interaction. (b) Side-view showing an FMDV biological protomer drawn in cartoon format with the proteins coloured by chain as in Fig. 1c. The integrin subunits are drawn in ribbon representation and coloured as in Fig. 2. Key interacting residues are drawn as sticks. The sugar is drawn as sticks in magenta. (c) Close-up of the VP1 GH loop/integrin interactions shown in a with the protein backbone drawn as a ribbon and the interacting side-chains as sticks. The magnesium ion expected to coordinate the MIDAS interaction is included as a grey sphere. (d) Close-up of the sugar interactions shown in a with the proteins depicted as in b.

