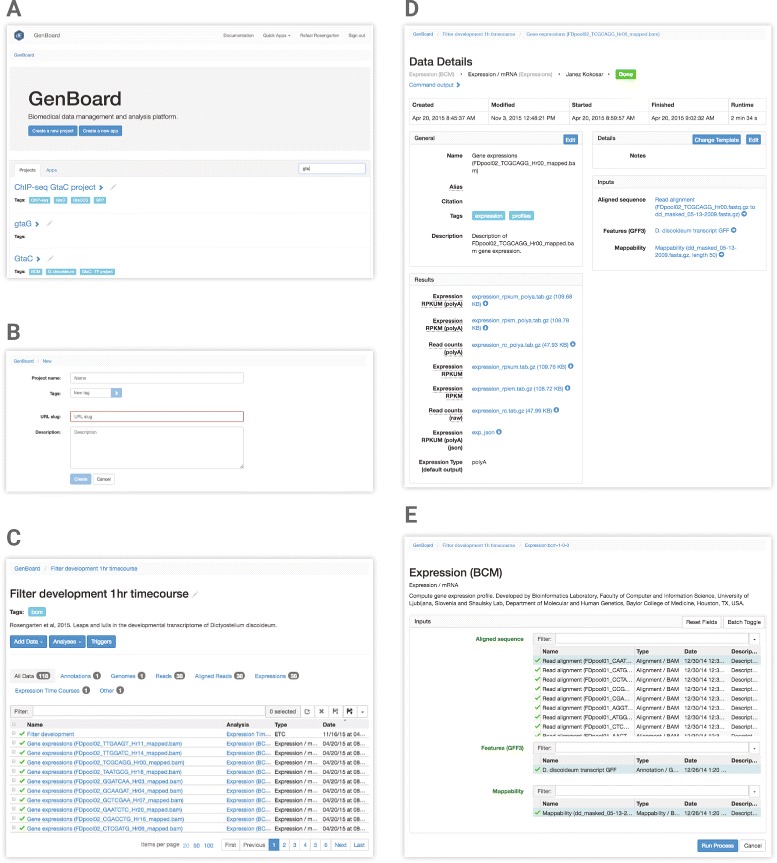
Fig. 3.

Genboard is the data management graphic user interface. Here users can create a new project, upload raw and processed data files, specify analysis algorithms and parameters, and link one step of the analysis process to another. a The user may search/filter among all existing projects based on the project name or descriptive tags. From this page a user may also create a new project (b). c Within a chosen project, the users find all of the data, input and output files associated with their bioinformatics analysis. These may be filtered by name, type, etc. Clicking on a file name in the table navigates to a data details page (d), while clicking on an analysis link in the table navigates to that analysis process (e)
