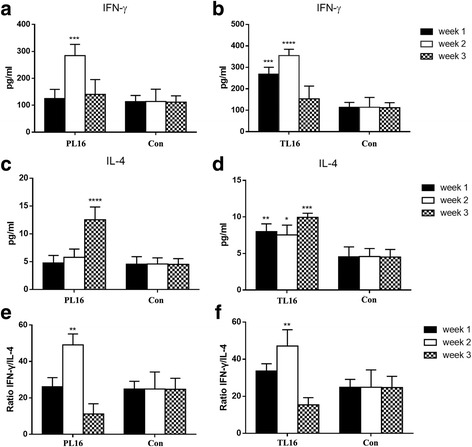
Fig. 3.

Concentration and ratio of serum cytokines in mice. Concentration of serum IFN-γ (a) and IL-4 (c) in the PL16 group. Concentration of serum IFN-γ (b) and IL-4 (d) in the TL16 group. Ratio of IFN-γ to IL-4 in the PL16 (e) and TL16 (f) groups. *p < 0.05, **p < 0.01, ***p < 0.001, and ****p < 0.0001 compared with Con. L16: S. lactis, Con: control group. Data are presented as the mean ± SD
