
Fig. 1.
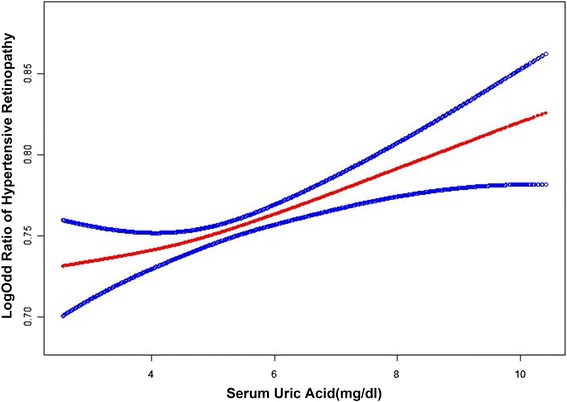
Smooth curve fitting of hypertensive retinopathy and serum uric acid. Data from 0.5% of the tails on either end of the distribution were deleted prior to performing a smooth curve fitting after adjusting for all variables. With increasing serum uric acid (SUA) levels, the risk of hypertensive retinopathy (HR) increases. The red line represents the best-fit line; the blue lines are 95% confidence intervals