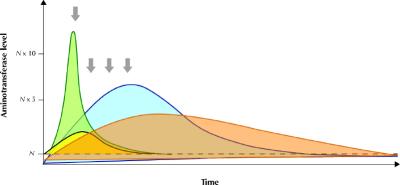
Fig. 3: Schematic representation of the rate of change of aminotransferase and bilirubin levels in a patient with acute ischemic hepatitis (green area, yellow area respectively) and acute viral hepatitis (blue area, orange area respectively). It is important to underscore that the pattern of enzyme alteration may vary and occasionally appear similar if a single observation point is taken into consideration (arrows).
