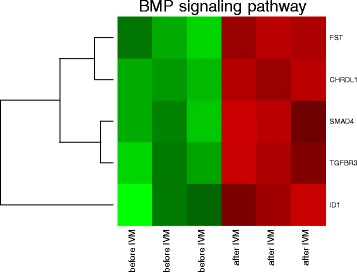
Fig. 1.

Heat map representing differentially expressed genes belonging to the “BMP signaling pathway” - functional category from DAVID GEOTERM BP database. Arbitrary signal intensity acquired from microarray analysis is represented by colors (green – higher, red - lower expression). Log2 signal intensity values for any single gene were resized to Row Z-Score scale (from −2 - the lowest expression to +2 - the highest expression for single gene)
