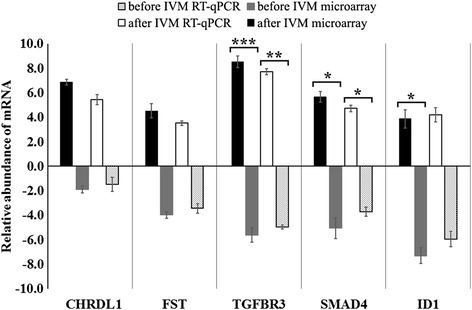
Fig. 2.

Validation of microarray data by RT-qPCR. Comparison of gene expression analysis of oocytes before IVM and after IVM using microarray assay and RT-qPCR. RT-qPCR analysis was normalized to the expression of three housekeeping genes (PBGD, β-actin, 18S rRNA). Error bars represent the standard error of the mean (SEM) for groups of oocytes. Statistically significant differences are presented as: *p < 0.05, **p < 0.01, and ***p < 0.001
