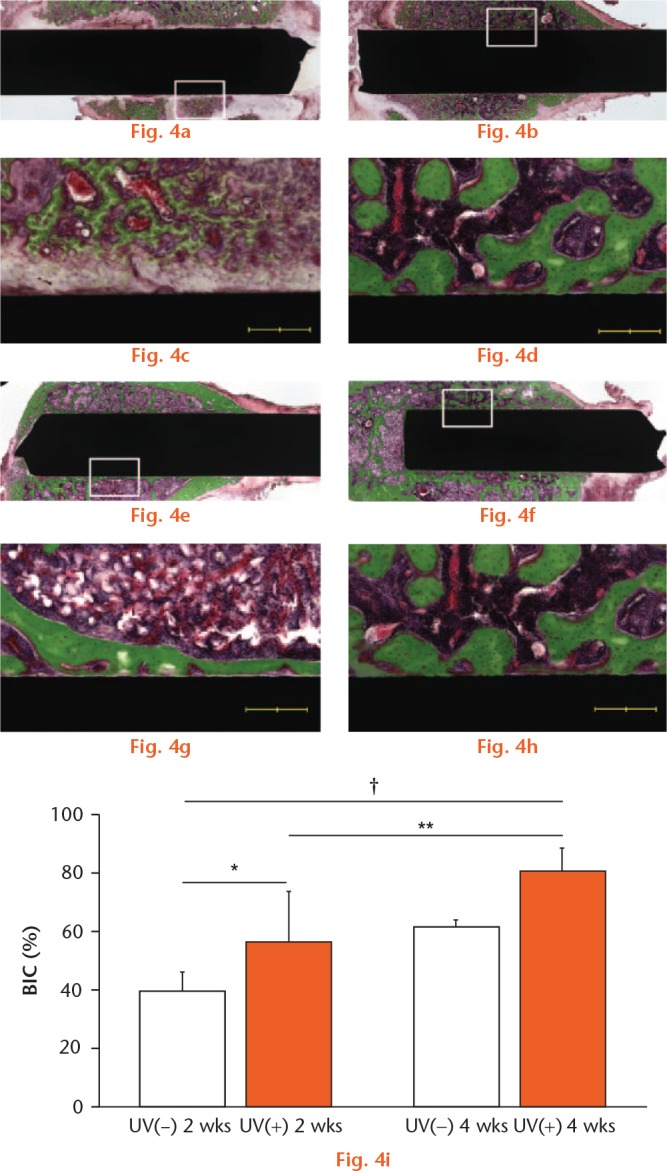
Light microscope images (magnification ×4 and ×10, higher magnification images of the boxed areas) two and four weeks after implantation. The micrographs show the bone response for (A, C, E, G) 64Ti(−) and (B, D, F, H) 64Ti(+) implants. Scale bar: 200 μm. (I) BIC ratios for 64Ti(−) and 64Ti(+) were calculated. Results are shown as mean percentage ± standard deviation. p < 0.05, *64Ti(−) vs 64Ti(+), †64Ti(−) 2 w vs 64Ti(+) 4 w (n = 5).
