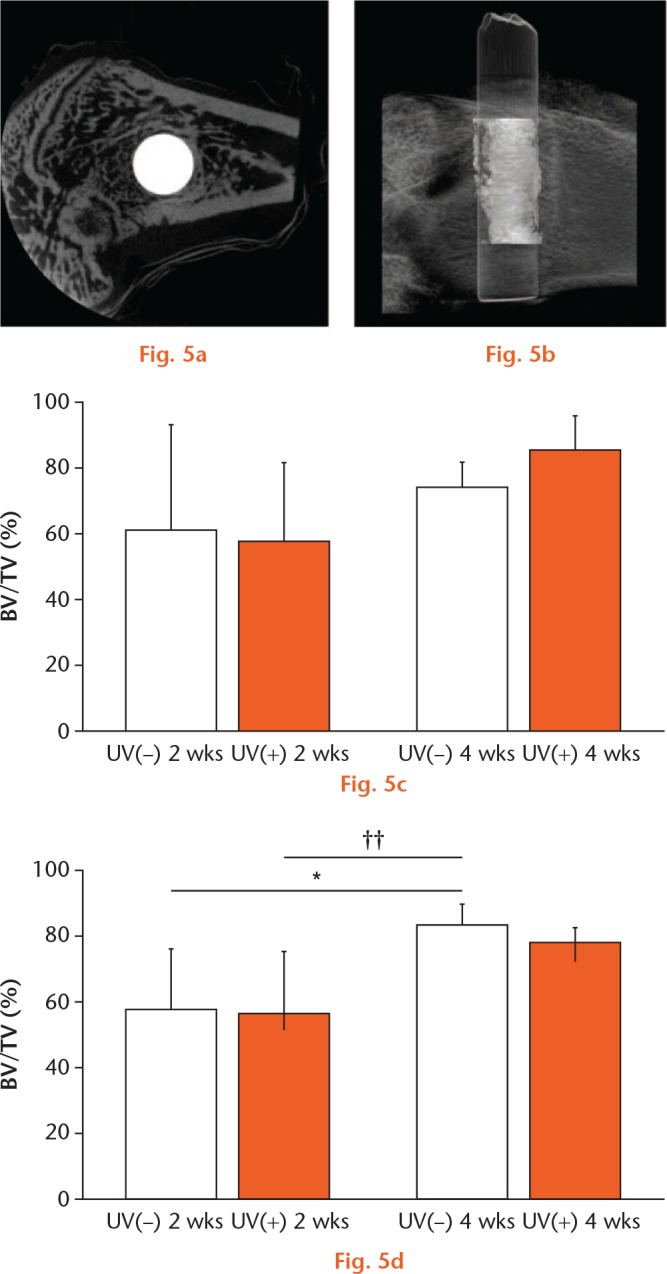
BV ratio was calculated using micro CT. a) The image shows a representative cross-sectional microcomputed tomography slice in the perpendicular direction to the longitudinal axis of the implant. Scale bar: 1 mm. b) The image shows a representative three-dimensional computed tomography image around the implant. Scale bar: 2000 μm. BV ratios for c) Ti and d) Ti6Al4V were calculated. Results are shown as mean percentage and standard deviation. p < 0.05, *UV(−) vs UV(+), ††64Ti(−) 2 w vs 64Ti(−) 4 w (n = 5).
