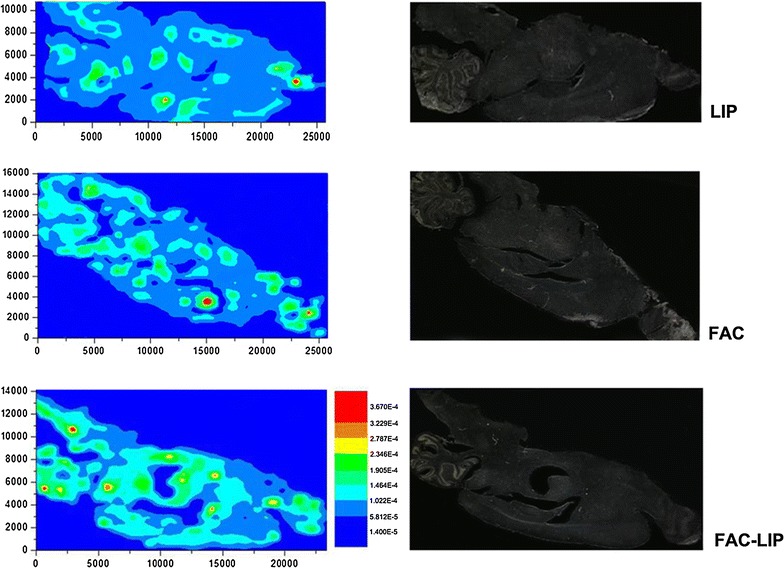
Fig. 2.

Distribution of iron in rat brain after intranasal administration of LIP, FAC or FAC-LIP. Sagittal brain sections were cut as described in “Methods”. The left three images show the mapping results with μ-XRF, and iron levels in different brain regions are indicated by different colors. Blue indicates the lowest iron level, and red indicates the highest iron level as shown in the illustration. The right three images show the morphology of the brain sections corresponding to the left images. n = 3
