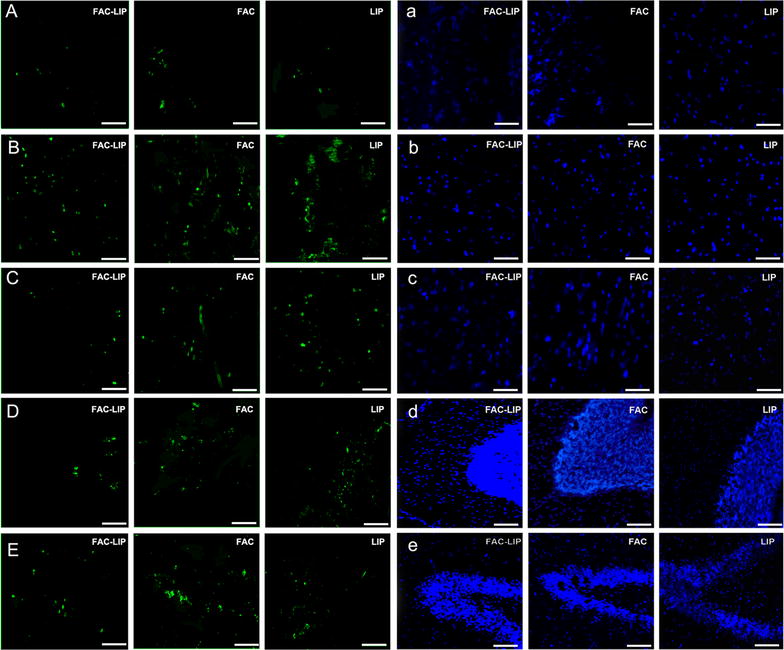
Fig. 5.

Cell apoptosis was assessed by TUNEL staining. The nuclei were stained with DAPI. In the left panel, green fluorescence shows the apoptotic cells in olfactory bulb (A), cerebral cortex (B), striatum (C), cerebellum (D) and hippocampus (E). In the right, blue fluorescence shows the cell nuclei corresponding to the left sections (a–e). n = 3
