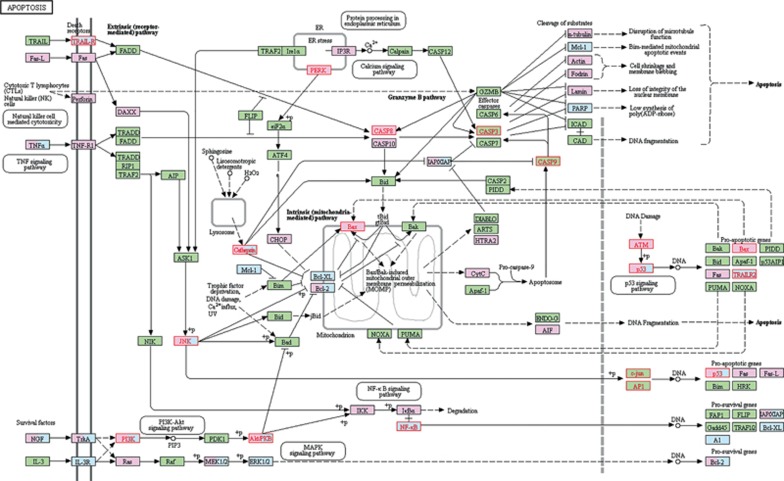
Figure 6.
Apoptosis pathway. This figure was generated from KEGG PATHWAY Database. The mapped genes were marked in red by pathway mapping tools embedded in KEGG on the KEGG map 04210. We chose the Homo sapiens (human)+ disease/drug pathway as the specific organism pathway. Pink rectangles indicate disease targets. Blue rectangles indicate drug targets. The names of the 18 mapped targets are highlighted in red.

