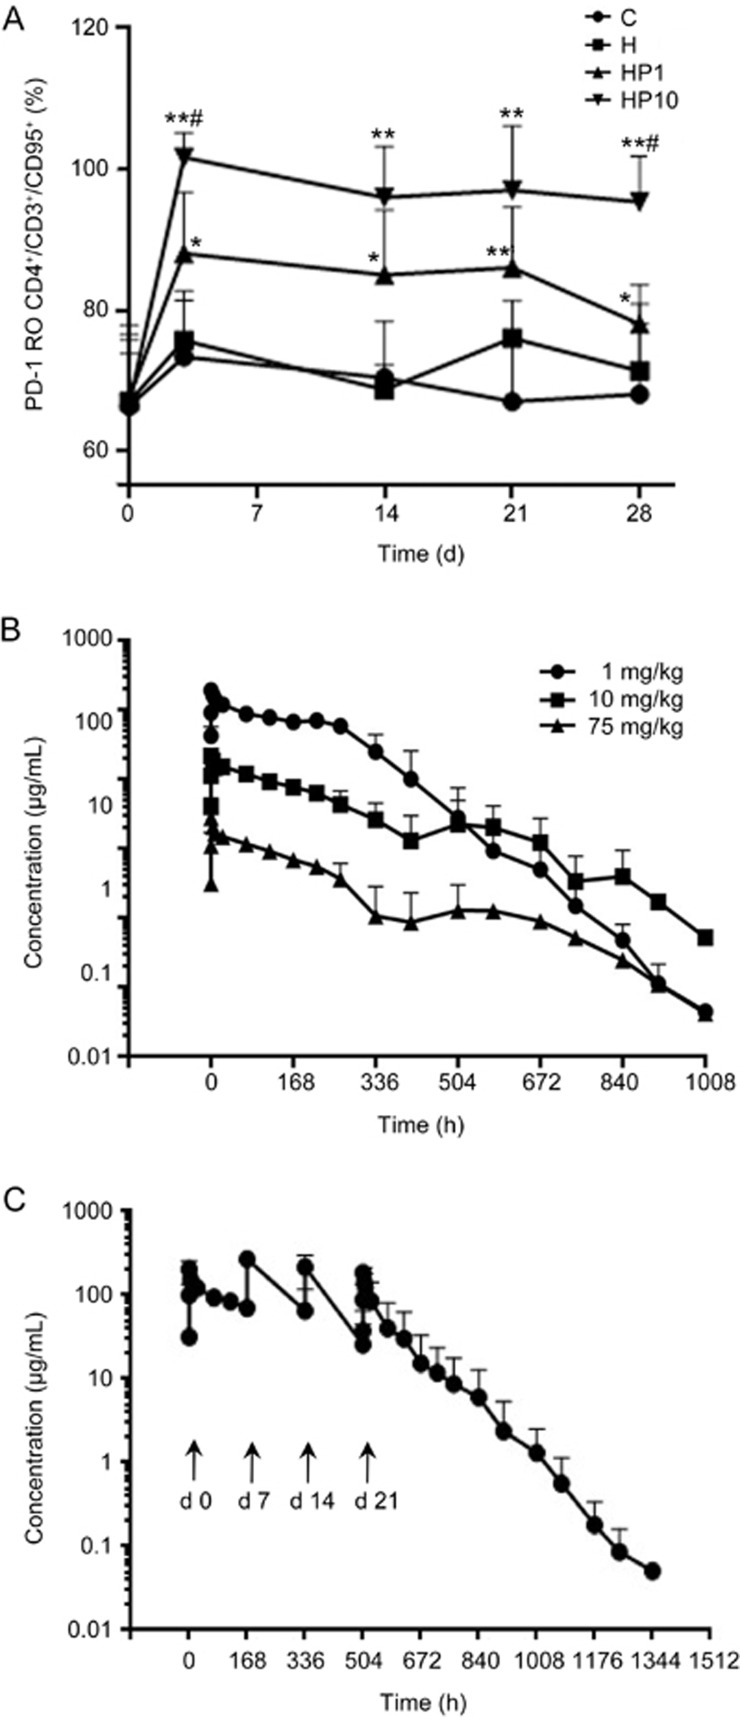
Figure 4.
PD-1 receptor occupancy and PK profiles. (A) PD-1 RO experiment was performed by FCA; a detailed description is available in Materials and Methods. Long-term PD-1 occupancy analysis in the four groups. *P<0.05, **P<0.01 vs H. #P<0.05 vs HP1. Data are shown as the mean±SD from 3 independently analyzed monkeys. (B) Drug concentration time curves of cynomolgus macaques after a single vd administration of JS-001 at low, mid, and high dosages (mean±SD, n=6). (C) Drug concentration-time curves of cynomolgus macaques after successive vd administrations of 10 mg/kg JS-001 (mean±SD, n=6).

