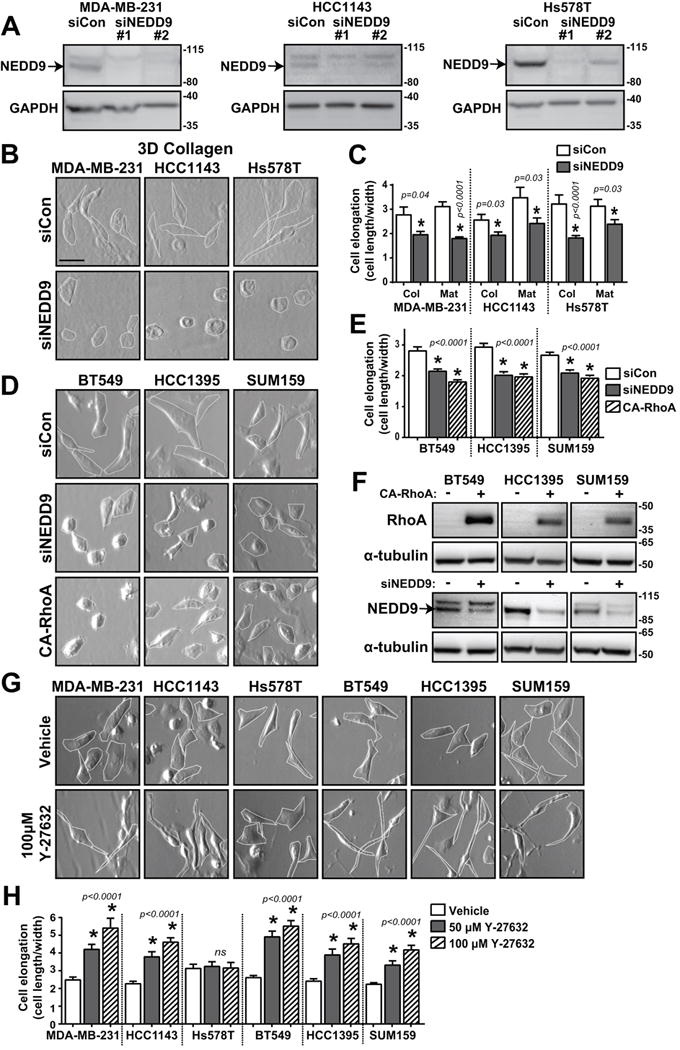
Fig. 1. TNBC cell morphology changes upon NEDD9 and ROCK inhibition.

(A) Western blot analysis of NEDD9 expression in MDA-MB-231, HCC1143, and Hs578T treated with multiple siRNAs. (B) Brightfield images of MDA-MB-231, HCC1143, and Hs578T cells treated with siCon or siNEDD9 in 3D collagen I and (C) cell elongation quantified as cell length/width (40 cells/group). (D) Brightfield images of BT549, HCC1395, and SUM159 cells expressing siCon, siNEDD9, or CA-RhoA, (E) cell elongation quantified as cell length/width (100 cells/group), and (F) western blots of NEDD9 knockdown and CA-RhoA expression. (G) Brightfield images of TNBC cells, vehicle or Y-27632 treatment and (H) cell elongation quantified as cell length/width (40 cells/group). ns, not significant; *p<0.05, student’s t-test vs control.
