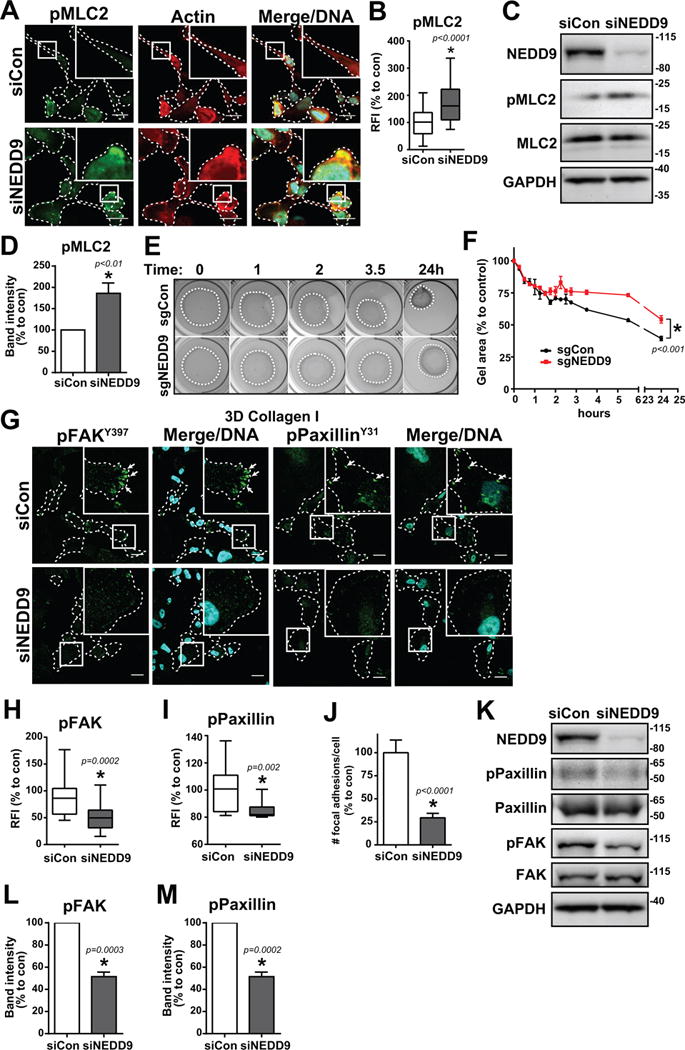
Fig. 2. NEDD9 depletion increases phosphorylation of MLC2 and decreases phosphorylation of FAK and paxillin.

(A) MDA-MB-231 siCon and siNEDD9 cells in collagen I stained for pMLC2, actin, and Hoechst DNA dye. Scale bar, 20 μm. (B) Box and whisker plot of pMLC2 relative fluorescence intensity (RFI), n = 3, 20–30 cells/group. Intensity was normalized to the cell area. (C) Western blot and (D) quantification of MLC2 phosphorylation, n = 3. (E) Collagen gel contraction assay of MDA-MB-231 CRISPR sgCon/sgNEDD9 cells over 24 hours and (F) quantification of collagen gel area, n = 3. (G) MDA-MB-231 siCon and siNEDD9 cells in collagen I stained for pFAKY397 or pPaxillinY31 and Hoechst DNA dye. Scale bar, 20 μm. (H) Box and whisker plot of pFAKY397 fluorescence and (I) pPaxillinY31 fluorescence, n = 3, at least 20 cells/group. (J) Quantification of # of focal adhesions per cell, n = 3, at least 20 cells/group. (K) Western blot and quantification of (L) FAK and (M) paxillin phosphorylation. n = 3. *p<0.05, student’s t-test vs control.
