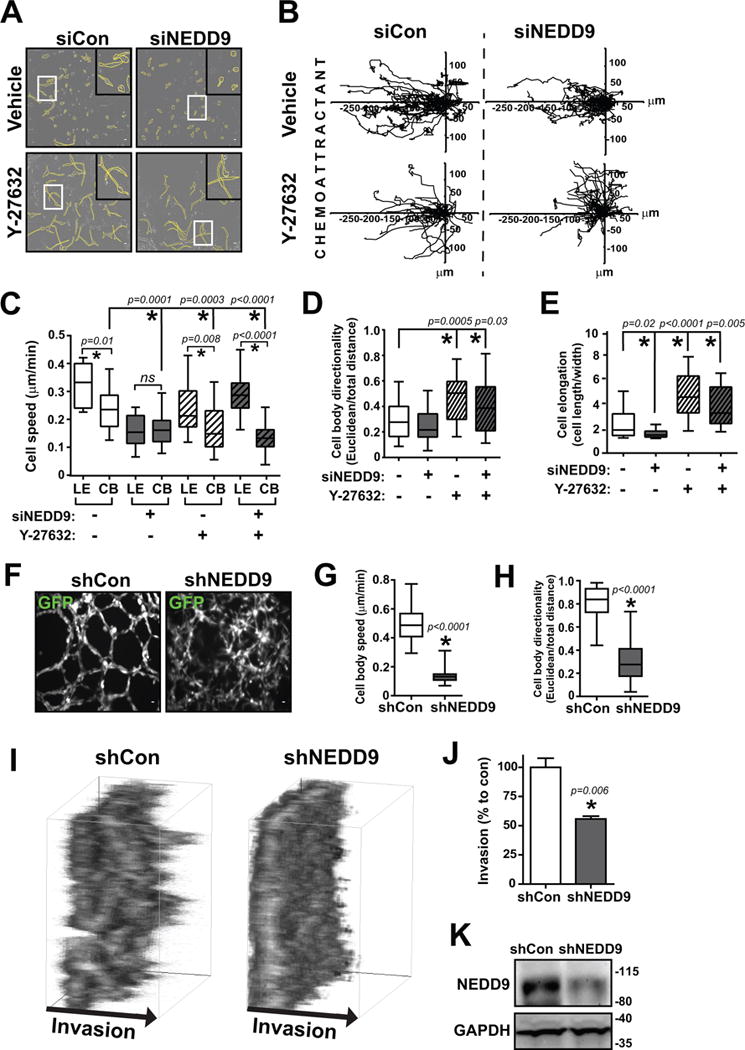
Fig. 5. Simultaneous targeting of NEDD9 and ROCK/RhoA hinders breast cancer cell motility/invasion in vitro.

(A) Brightfield outlined cell morphology images (~12 hours), (B) individual cell tracking movement plots toward FBS chemoattractant (left), box and whisker plots of (C) cell body (CB) and leading edge (LE) speed, (D) cell body directionality, and (E) cell elongation of MDA-MB-231 cells with siCon/siNEDD9 + Vehicle/Y-27632 treatment in 3D collagen Ibidi chemotactic invasion movies. Scale bar, 20 μm. n = 3, 30–40 cells per group. ns, not significant; *p<0.05, one-way ANOVA. (F) GFP immunofluorescence images and box and whisker plots of (G) cell body speed and (H) cell body directionality of MDA-MB-231 pGIPZ-GFP shControl and shNEDD9 cells after 24 hours being densely seeded in a 3D Matrigel sandwich assay. Scale bar: 20 μm. n = 3, at least 60 cells per group. *p<0.05, student’s t-test vs control. (I) 3D projection boxes and (J) collective invasion quantification of the amount of MDA-MB-231 pGIPZ-GFP shControl/shNEDD9 cells reaching 100 μm invasion distance after 72 hours being densely seeded in a 3D Matrigel sandwich assay. *p<0.05, student’s t-test vs control. (K) Western blot of shNEDD9 knockdown in collective invasion assay.
