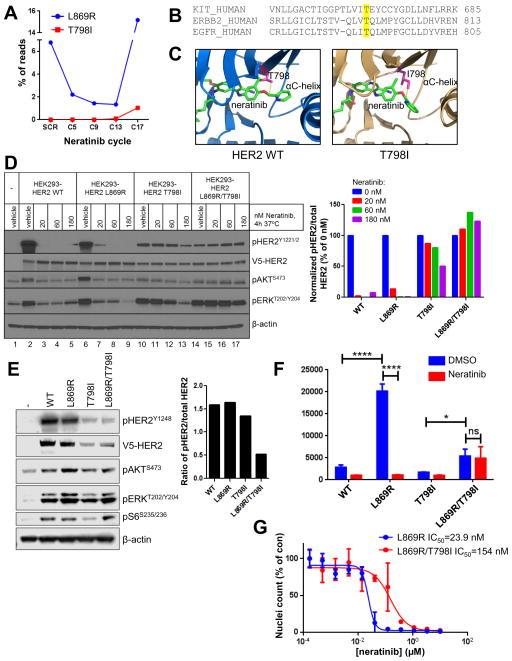
Fig. 2. HER2T798I induces acquired resistance to neratinib.
(A) The patient’s plasma was drawn at the time of clinical trial screening (SCR) and the indicated cycles of neratinib therapy (1 cycle = 28 days). Plasma cfDNA was subjected to ERBB2 targeted capture and sequenced. (B) The amino acid sequences of human KIT, ERBB2, and EGFR were aligned using Clustal Omega. KIT T670, ERBB2 T798, and EGFR T790 gatekeeper residues are highlighted in yellow. (C) The structure of HER2WT and a model of HER2T798I are shown with neratinib bound to the kinase pocket. The threonine (WT) or isoleucine (mutant) residue at position 798 is shown in pink. (D) HEK293 cells were transiently transfected with V5-tagged HER2WT, HER2L869R, HER2T798I or HER2L869R/T798I and treated with the indicated concentrations of neratinib for 4 h in serum-free media. Cell lysates were subjected to immunoblot analyses with the indicated antibodies. The bar graph represents quantification of immunoblot bands using ImageJ software. (E) MCF10A cells stably expressing V5- tagged HER2WT, HER2L869R, HER2T798I or HER2L869R/T798I were cultured in MCF10A growth factor-depleted media. Cell lysates were subjected to immunoblot analyses with the indicated antibodies. The bar graph represents quantification of immunoblot bands using ImageJ software. (F) MCF10A cells from (E) were treated ± 123 nM neratinib in growth factor-depleted media for 6 days. Nuclei were stained with Hoechst and scored using the ImageXpress system. Data represent the average ± SD of 4 replicate wells (*p<0.05, ****p<0.0001, ANOVA followed by Tukey’s multiple comparisons test). (G) MCF10A cells stably expressing HER2L869R (blue) or HER2L869R/T798I (red) were treated with increasing concentrations of neratinib for 6 days. Nuclei were stained with Hoechst and scored using the ImageXpress system. Data represent the average ± SD of 4 replicate wells. IC50 values were calculated using GraphPad Prism.

