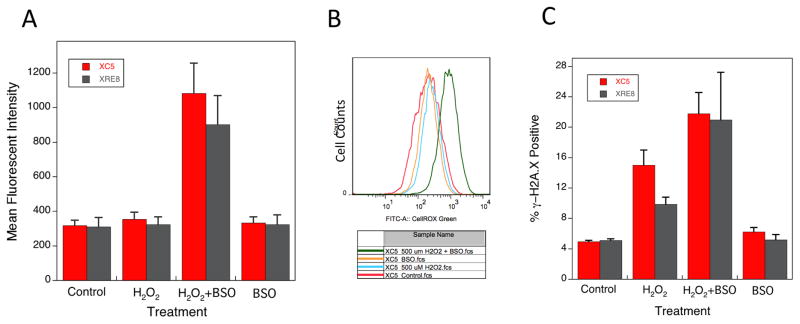
Fig. 4.
Cellular oxidative stress and DNA damage as a result of H2O2 treatment. Oxidative stress was analyzed using flow cytometry and CellROX® Green reagent that binds to DNA upon oxidation as described in Section 2.5. (A) Mean fluorescent intensity in XC5 and XRE8 cells treated with H2O2 (500 μM for 1 h), BSO (15 μM pre-treatment for 16 h) or a combination of the two agents. Cells were analyzed 3 h after H2O2 dosing. Plotted are values from at least 3 experiments ± SEM. (B) Histogram overlay showing CellRox® Green fluorescence intensity (FITC-A) of XC5 cells after the same treatments as described in (A). (C) Phosphorylation of histone H2A.X, an indicator of DNA strand breaks, was analyzed using flow cytometry and the EMD Millipore H2A.X Phosphorylation Assay kit as described in Section 2.6. Cells treated with H2O2 (500 μM for 1 h), BSO (15 μM pre-treatment for 16 h) or a combination of the two agents. Cells were analyzed 3 h after H2O2 dosing. Plotted are % γ-H2A.X positive cells after cell treatments as indicated.

