Fig. 5.
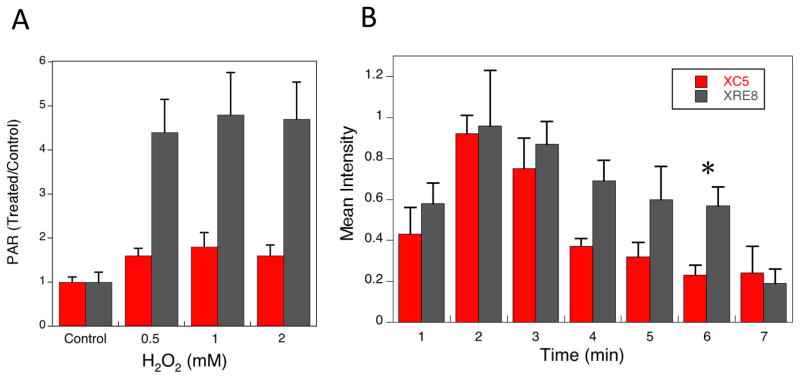
Analysis of cellular PAR after H2O2 exposure and following micro-irradiation. (A) Total cellular PAR levels were analyzed using the Trevigen PARP in vivo Pharmacodynamic Assay kit as described in Section 2.7. Cells were treated for 20 min at 4 °C with 0.5 – 2 mM H2O2 and allowed to repair for 10 min at 37 °C prior to analysis. Plotted are PAR values in H2O2-treated cells relative to untreated control cells of the same cell type, mean values from 3 experiments ± SEM. The control PAR values are 677 ± 56 and 337 ± 54 pg/ml in XC5 and XRE8, respectively. In XRE8, PAR values at all H2O2 concentrations were significantly higher than in control cells, whereas in XC5 there was no significant difference between control and treated (P<0.02). (B) Time course of PAR synthesis in XC5 cells (wild-type XRCC1) and in XRE8 cells (C12A XRCC1) at UV micro-irradiation damaged sites at the repair times specified (1–7 min). Representative images of PAR immunostaining at 1 min can be found in Figure 1A. Anti-PAR antibody with Alexa 647 conjugated anti-chicken secondary antibody were used for immunofluorescence analysis as described in section 2.2. At least 5 cells were analyzed at each time point, error bars represent SEM. The asterisk denotes statistical significance (P<0.05) between the two cell types at 6 min.

