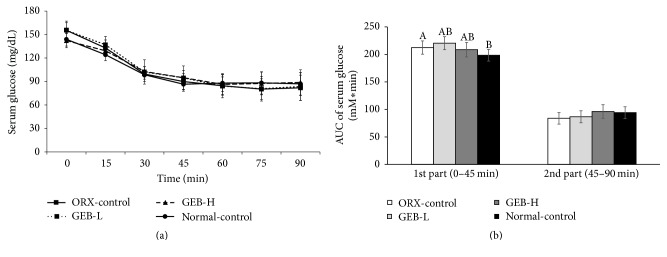
Figure 3.
Changes of serum glucose concentrations during the intraperitoneal insulin tolerance test (IPITT). Orchidectomized (ORX) rats consumed either 1% cellulose (ORX-control), 0.3% GEB (GEB-L), or 1% GEB (GEB-H) in a 43% fat diet for 8 weeks. Sham rats had 1% cellulose (normal-control). ITT was conducted with intraperitoneal injection of 0.75 IU insulin/kg body weight and measured serum glucose concentrations in blood collected from the tail every 15 min for 90 min. Changes of serum glucose levels were measured during IPITT (a). The average of the area under the curve (AUC) of glucose (b) during the first part (0–45 min) and second part (45–120 min) of ITT. Each dot and bar and error bar represents the mean ± SD (n = 10). A, B, CValues of the bars with different superscripts were significantly different among groups in Tukey's test at P < 0.05.

