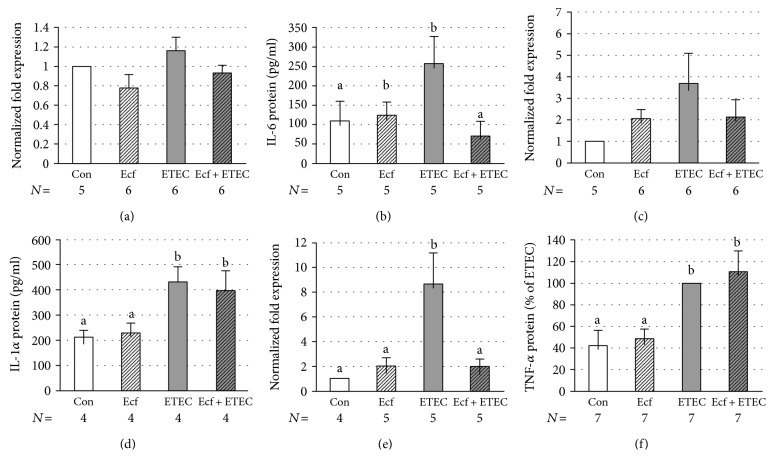
Figure 7.
mRNA expression of IL-6 (a), IL-1α (c), and TNF-α (e) and cytokine release of IL-6 (b), IL-1α (d), and TNF-α (f) from IPEC-J2 cells after treatment with bacterial strains (Ecf, ETEC, and Ecf + ETEC) or without bacteria (Con = control) [means ± SEM]. Samples were taken after 4 h (mRNA) or 8 h (protein release). Groups differ significantly (P ≤ 0.05) when marked with different letters, (e.g. a, b) in the figure. N = number of independent experiments as indicated in the figure caption.

