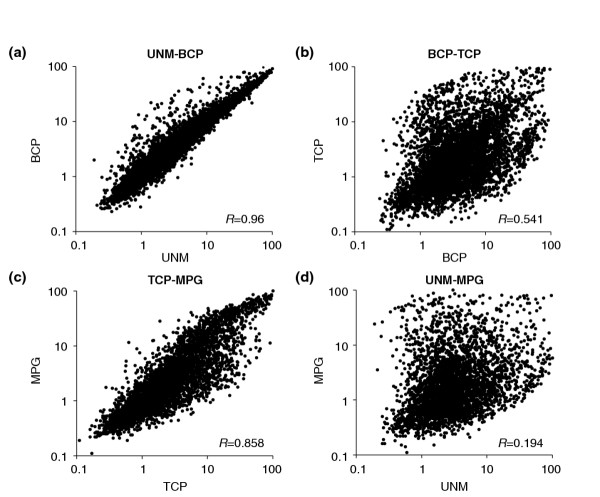
Figure 2.

Scatter-plots comparing relative gene expression in pairs of developmental stages. The expression levels of individual genes were normalized using a logarithmic scale of 0 to 100 and genes coexpressed in pairs of transcriptome datasets were plotted. (a) UNM versus BCP stage; (b) BCP versus TCP stage; (c) TCP versus MPG stage; (d) UNM versus MPG stage. R-value represents the correlation coefficient.
