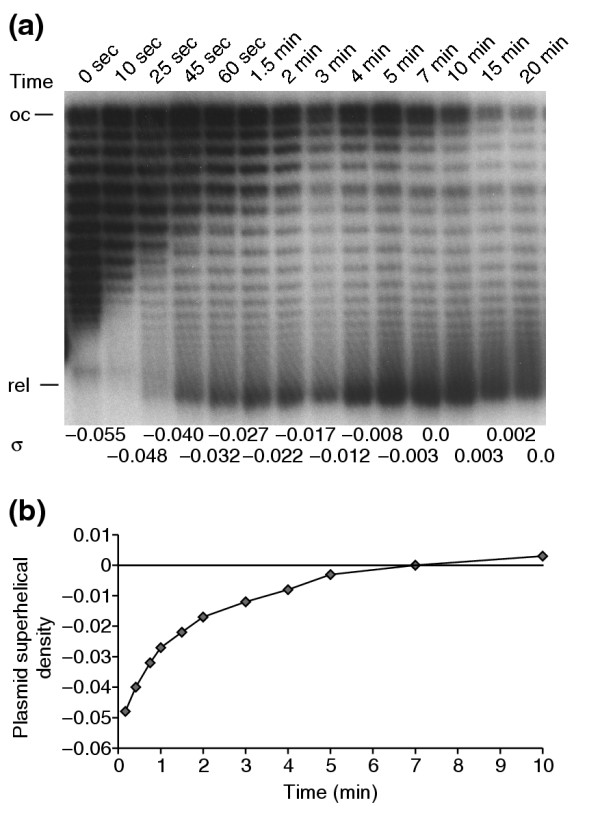
Figure 3.

Plasmid relaxation kinetics. gyrA+parC+ cells were treated with 15 μg/ml norfloxacin for the indicated times before samples were removed for DNA and microarray analysis. (a) pBR322 plasmid DNA was isolated and run on a 1% agarose gel + 2.8 μg/ml chloroquine to provide an indicator of topoisomerase activity in the cells. The positions of open circular (oc) and relaxed (rel) marker plasmids on the gel are shown. The distribution of native (-) supercoiled DNA is shown in lane 1. As the plasmid becomes relaxed, the center of the distribution first moves toward the open circular form and then moves down the gel to the relaxed position. The calculated superhelical density values for the plasmids (σ) are shown at bottom of each lane. (b) Graph of the average σ values from (a). Values of σ stabilized around 0 for times greater than 10 min and are not shown.
