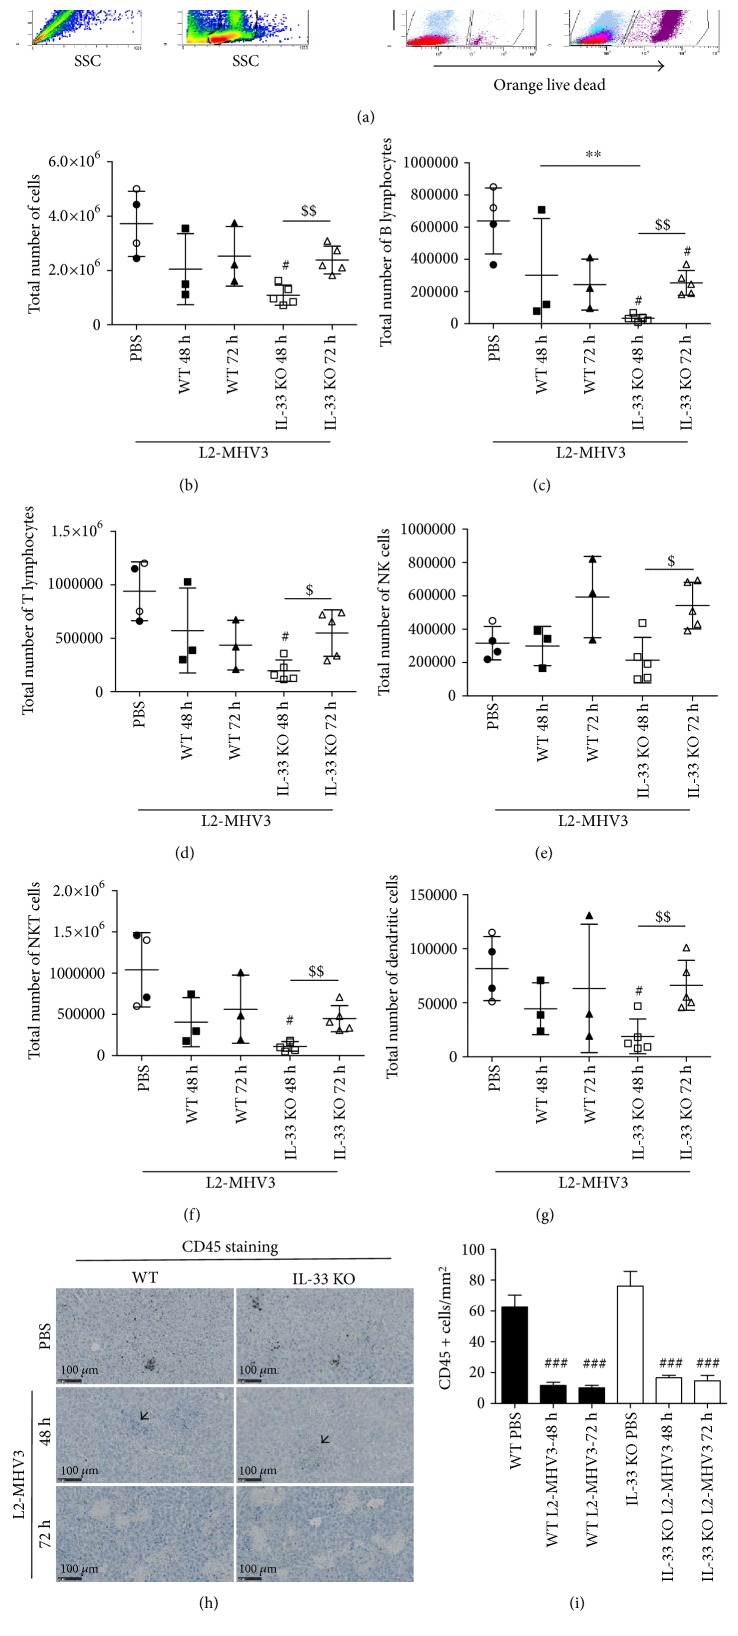
Figure 4.
Flow cytometry analysis and immunohistochemistry of liver-infiltrated lymphoid cells in the WT and IL-33 KO mice following L2-MHV3-induced hepatitis. (a) The strategy of gating alive cells after SSC/SSC and FSC/SSC gating and orange live-dead staining. (b) Total number of cells, (c) B lymphocytes, (d) T lymphocytes, (e) NK cells, (f) NKT cells, and (g) dendritic cells were quantified in the liver of WT and IL-33 KO mice in control PBS condition (black dot for WT PBS and clear dot for IL-33 KO PBS) and after 48 h and 72 h L2-MHV3 infection. (h) CD45 immunostaining of paraffin-embedded mouse liver control (PBS) or infected with L2-MHV3 for 48 h or 72 h. Arrowhead highlights inflammatory foci unstained with CD45 antibody. (i) Quantification of CD45-stained cells on 4 areas of 1 mm2 by tissues and at least 3 different tissues by condition. Statistical analyses were done according to the Mann-Whitney U test. # represents significant difference with WT PBS condition, ∗ represents significant difference between WT and IL-33 KO conditions, and $ represents significant difference between two conditions in the same background mice. #p < 0.05; ##p < 0.01; and ###p < 0.001.

