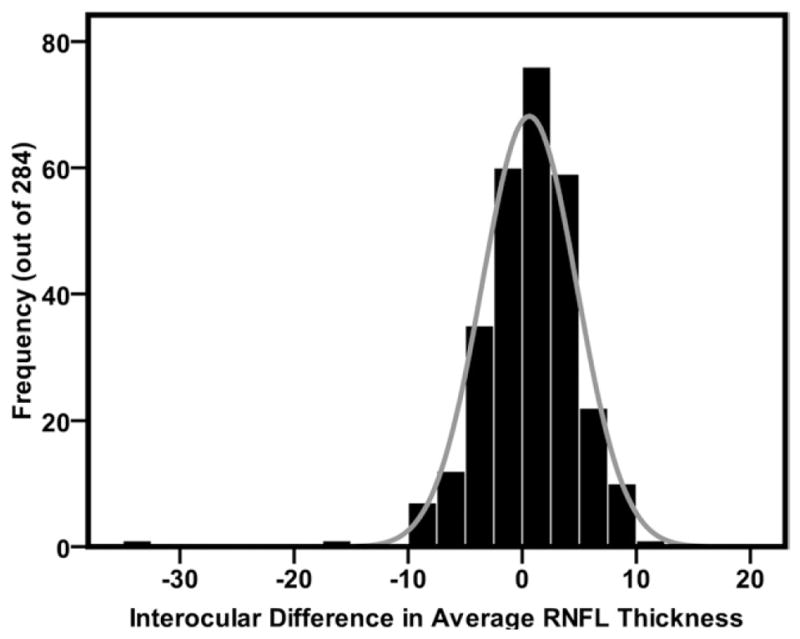
FIGURE 1.

Graph showing the frequency distribution of mean interocular difference (right eye minus left eye) in average retinal nerve fiber layer (RNFL) thickness (n = 284 pairs of eyes). The difference was mostly positive because more right eyes had thicker average RNFL, which is indicated by a slight skewness to the left.
