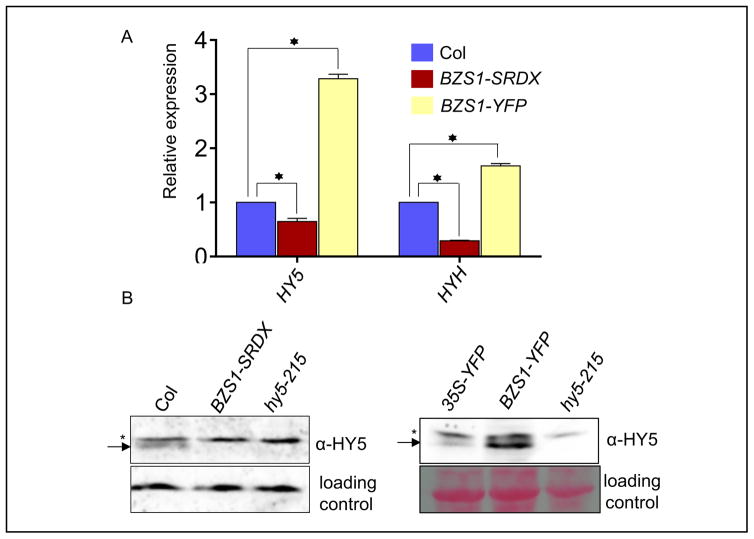
Fig. 3. BZS1 positively regulates HY5.
A: Quantitative RT-PCR analysis of HY5 and HYH expression levels in wild-type (Col), BZS1-SRDX and BZS1-YPF plants. Seedlings were grown under constant white light for five days. The actin2 gene was used as an internal reference. Significant differences from wild type are marked as asterisks, P < 0.01. B: Western blot analysis of HY5 protein accumulation in BZS1-SRDX and BZS1-YFP plants. The arrows indicate HY5 protein and the asterisks mark a non-specific band. Seedlings were grown under continuous white light for 4 days and total proteins were immunoblotted with anti-HY5 antibody. The loading controls were a non-specific band on the blot (left) and the Ponceau S staining of total proteins (right).

