


FIGURE 2.
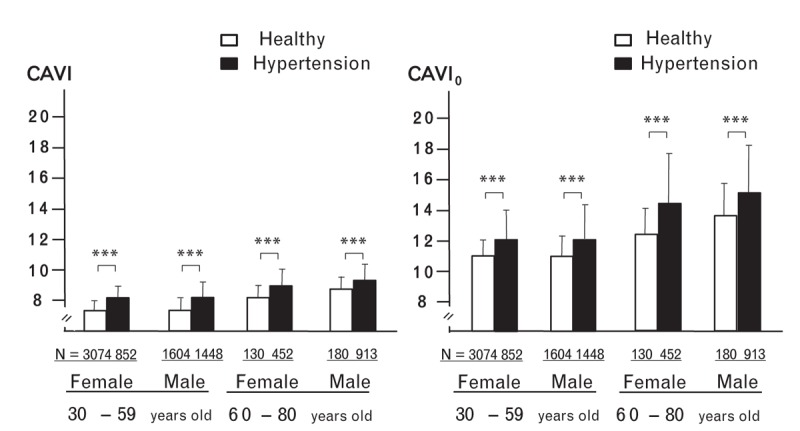
The comparison between cardio-ankle vascular index and cardio-ankle vascular index o in a hypertensive group and a healthy group. Data are presented as the mean ± SD. Unpaired Student's t test was used in comparisons with two groups. ∗P < 0.001. CAVI, cardio-ankle vascular index; CAVIo, cardio-ankle vascular index o.