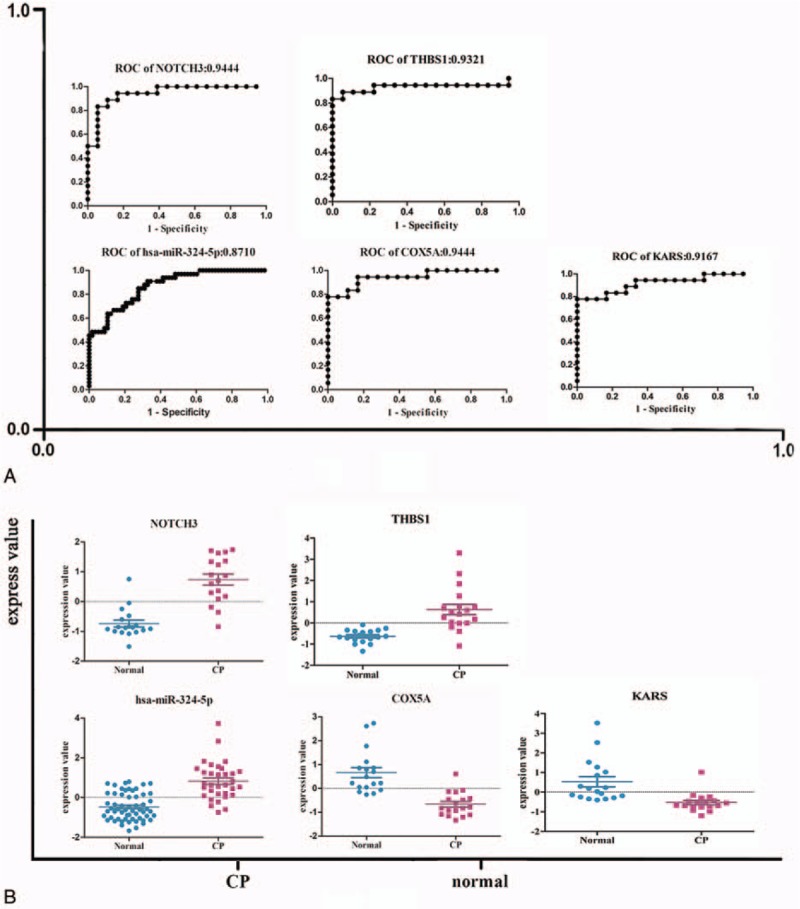
Figure 4.

(A) Expression level and receiver-operating characteristic curve (ROC) curve for the potential biomarkers. (B) The expression level of hsa-miR-324-5p, NOTCH3,COX5A, THBS1, and KARS. The ROC curve of hsa-miR-324-5p, NOTCH3, COX5A, THBS1, and KARS.
