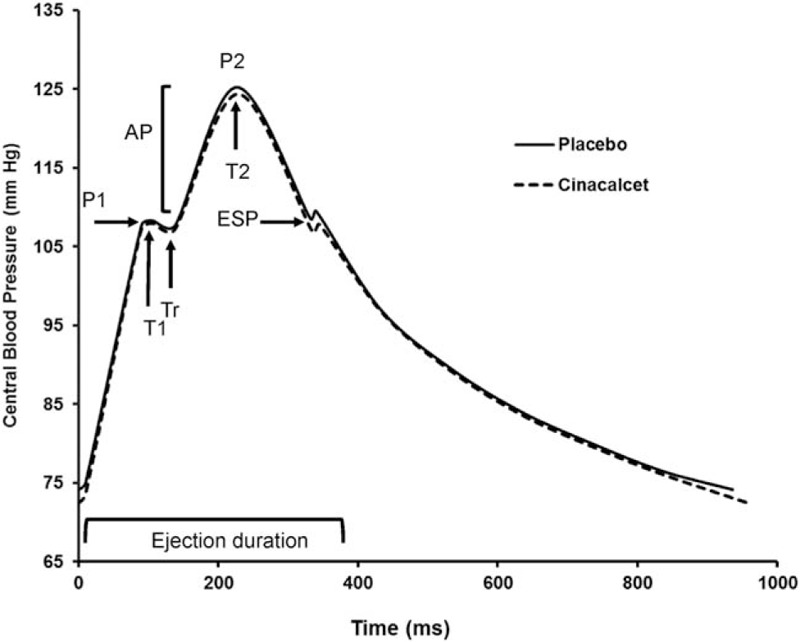
Figure 2.

Central pulse wave profile. The averaged central pulse wave profile has been reconstructed under placebo (–) and cinacalcet therapy (– –). There were no statistically significant differences in the various time and pressure components of the central pulse wave profile. AP = augmented pressure, Tr = time of reflection wave, T1 = time at first peak of pressure, T2 = time at second peak of pressure, P1 = first peak of pressure, P2 = second peak of pressure, ESP = end-systolic pressure.
