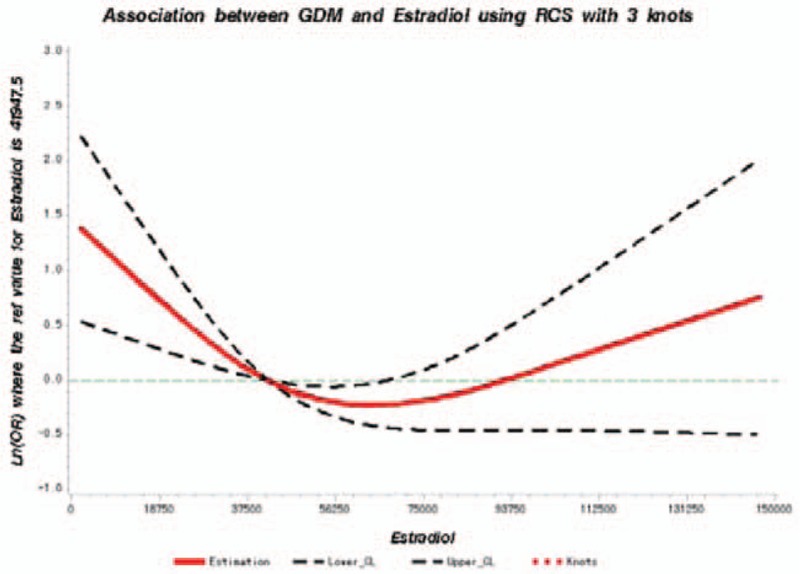
Figure 3.

Adjusted dose-response association between estradiol (pg/mL) and the presence of GDM with 3 knots located at the 5th, 50th, and 95th percentiles. Y-axis represents the Ln (odds ratio) to present GDM for any value of cord blood estradiol compared to individuals with 41,947.5 pmol/L. The red line is the adjusted curve and dashed lines are 95% confidence intervals. GDM = gestational diabetes mellitus.
