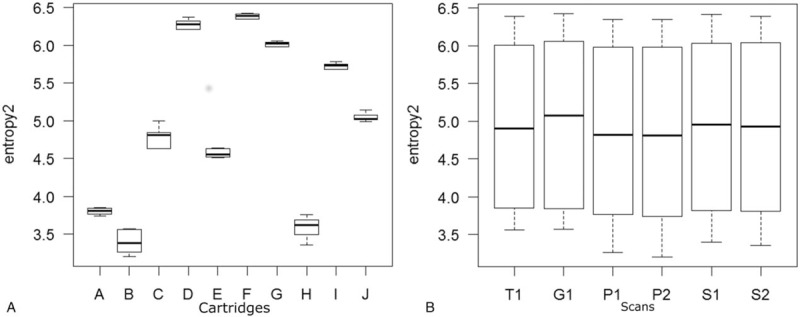
Figure 1.

Boxplots for entropy2. (A) For each cartridge of the phantom, interquartile ranges (IQR(x)), median, and maximum/minimum values of entropy2 among 6 scans are described as a box, a thick line, and a whisker, respectively. (B) For each scan, interquartile ranges (IQR(y)), median, and maximum/minimum values of entropy2 among 10 phantoms are described as a box, a thick line, and a whisker, respectively. Median value of IQR(y) for the 6 scans (IQRc) was used as a control to calculate variability index. IQR = interquartile range.
